

Service delivery
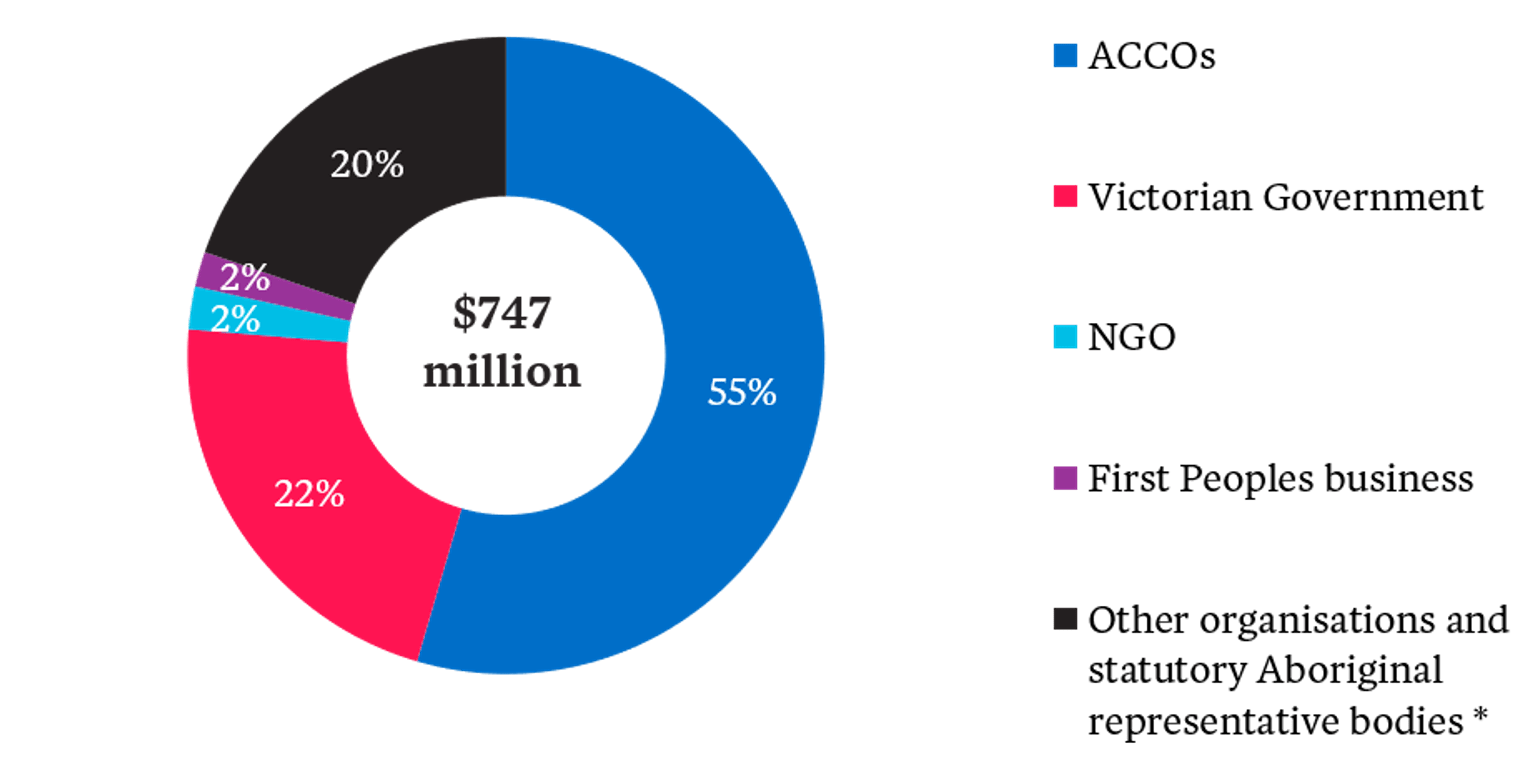
The departments were asked to specify the delivery mechanism for each program: Aboriginal Community Controlled Organisations (‘ACCOs’), Victorian Government, First Peoples business, local councils, NGOs, for-profit business (excluding First Peoples business) and other.
The data shows that:
- Over half of targeted expenditure is delivered through ACCOs
- Victorian Government delivers a high proportion of targeted services directly.
One limitation of the data is that it did not separately identify expenditure for Traditional Owner Corporations (TOCs). Departments in some cases classified these organisations as ACCOs, and in other cases classified them as ‘Other organisations and statutory Aboriginal representative bodies’. We recommend that Traditional Owner Corporations are included as a separate category in any future reporting.
Along with TOCs, the ‘Other organisations and statutory Aboriginal representative bodies’ category includes funding for universities, hospitals, local councils, businesses (other than First Peoples businesses) and other organisations.
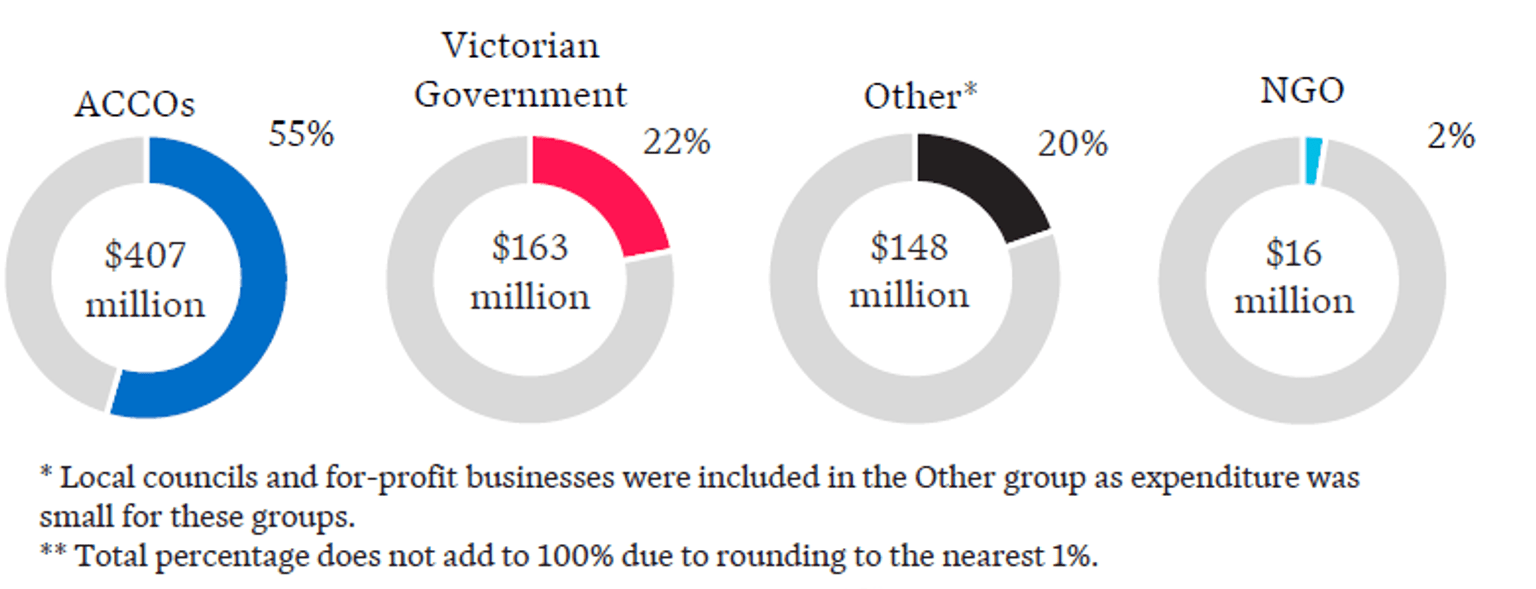
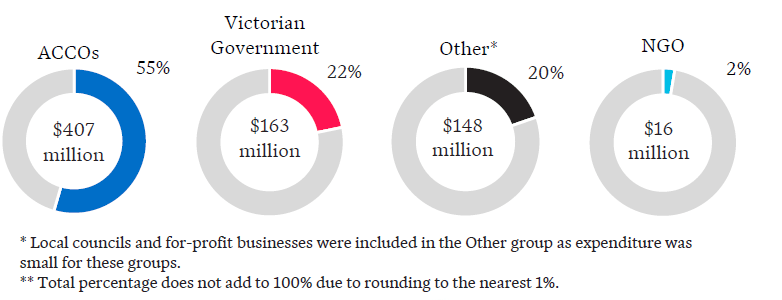
FY22/23 targeted expenditure by service delivery**
FY22/23 targeted expenditure by service delivery**
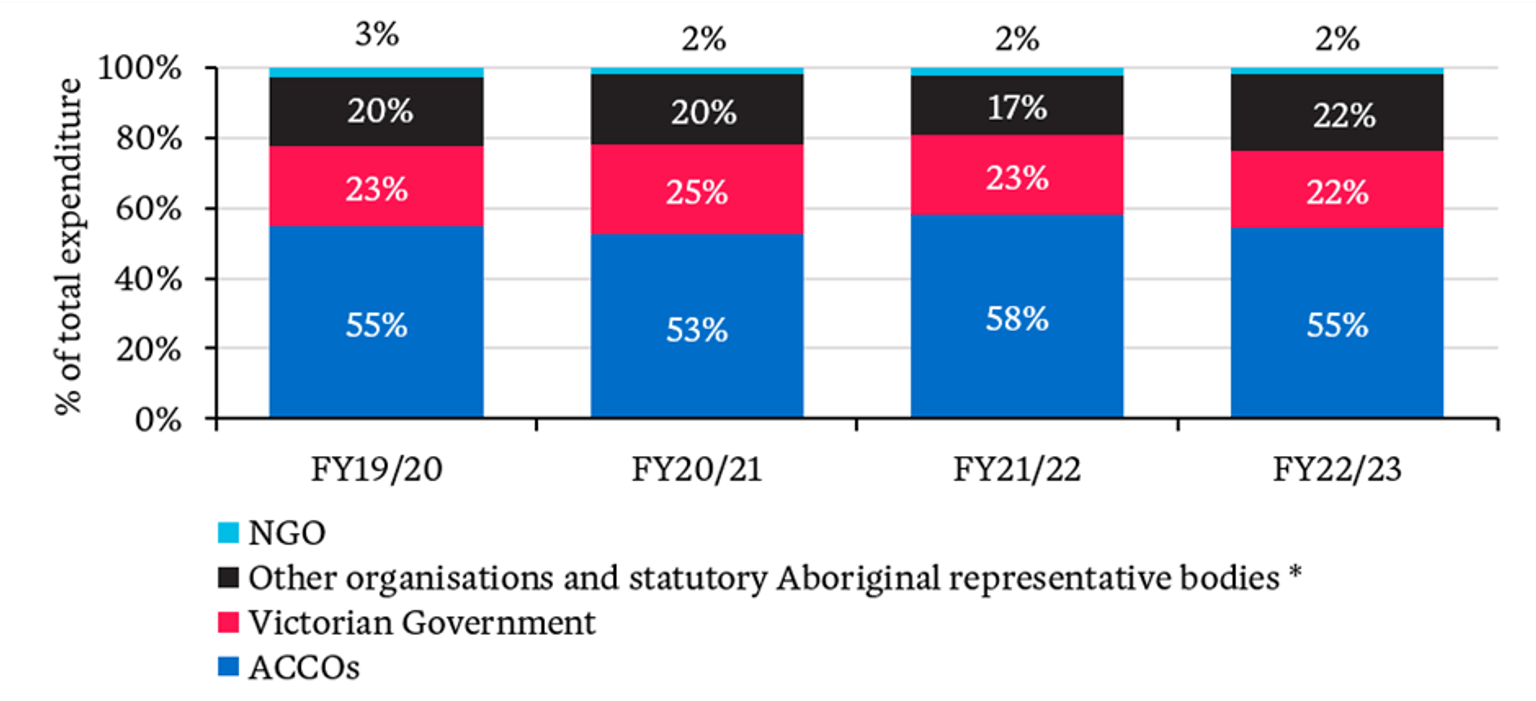
Service delivery trends over time
ACCOs are responsible for delivering more than half of the targeted expenditure over the period under review:
- Their share of service delivery is between 53% and 58% in all years
- Expenditure grew from $231M in FY19/20 to $407M in FY22/23 (+$176M)
The proportions of expenditure for each delivery mechanism are relatively stable over time. This suggests that total expenditure growth has been evenly distributed between ACCOs, Victorian Government, NGOs and other providers.
Expenditure by service delivery mechanism over time
Targeted expenditure delivered by ACCOs over time ($M)
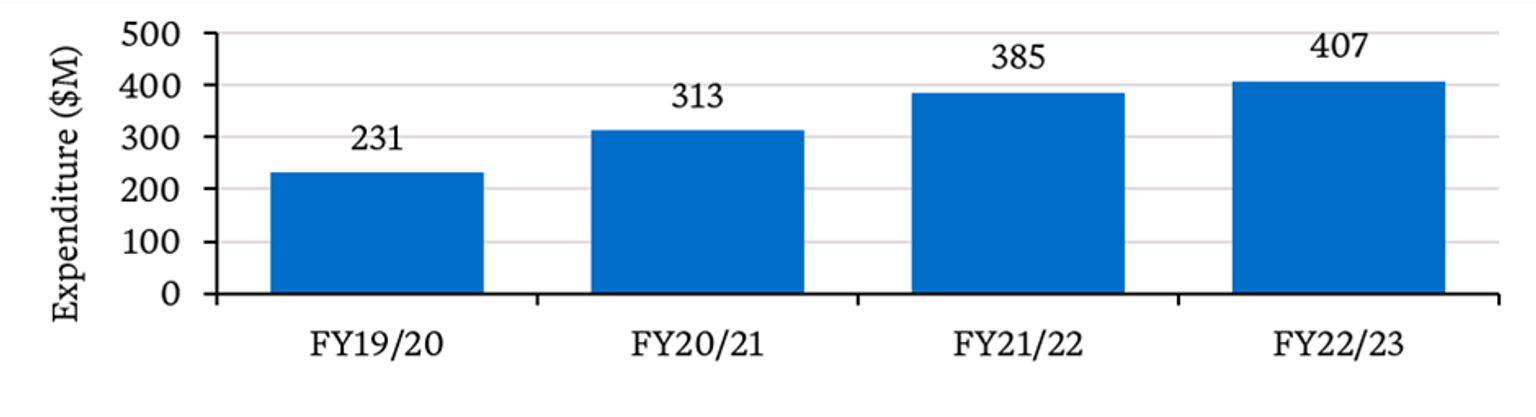
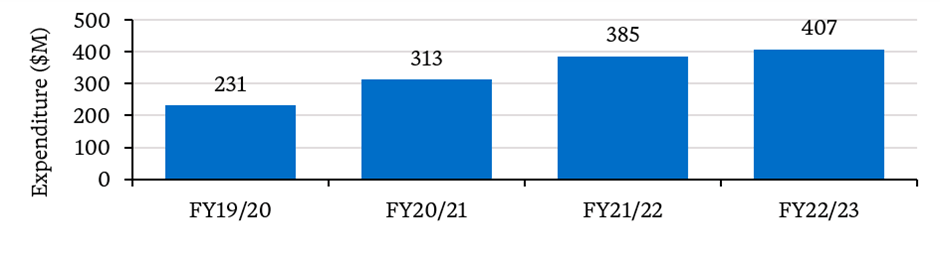
Program evaluations
Program evaluations support an understanding of the effectiveness of government investment and its impact on First Peoples in Victoria. The departments were asked to specify whether programs have undergone evaluation and if so, the type of evaluation.
53% of expenditure was on programs that have been evaluated. This excludes some programs that are unlikely to be eligible for evaluation, e.g. newly established programs and First Peoples-specific workforces in government.
47% of expenditure was on programs that have not been evaluated. Larger contributors to this include:
- Health. The department noted complexity in attributing performance to individual programs, as well as difficulties running evaluations during the pandemic. It also noted it has other monitoring and reporting arrangements that are used to foster accountability, and that its Aboriginal Health Division is leading reforms to outcomes-based funding and reporting that are expected to lay a foundation for future evaluation.
- Families, Fairness and Housing. While most programs have been evaluated, several larger ones had not as of FY22/23. Evaluations are planned in FY23/24 to cover a number of the larger program areas. Additionally, the department noted that there are other monitoring arrangements that support accountability, and that it is pursuing funding reforms with a greater focus on outcomes.
% of expenditure on programs that have been evaluated*
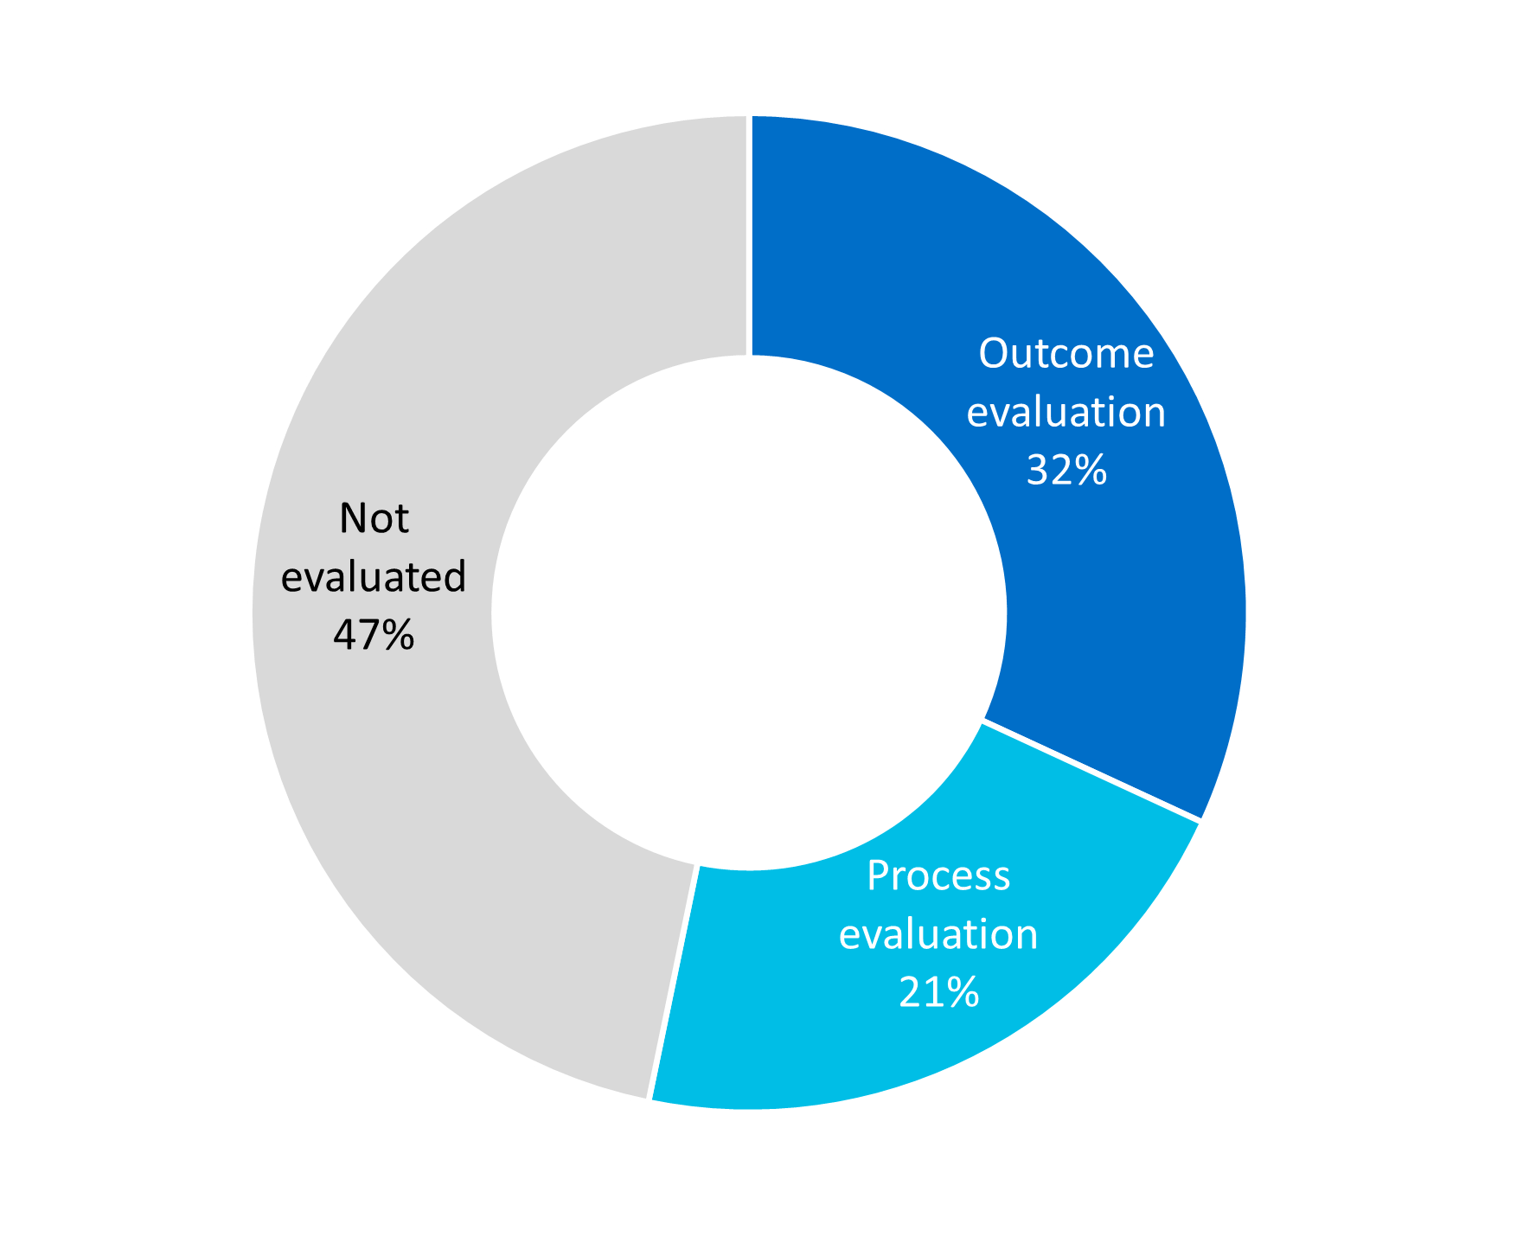
Funding approach
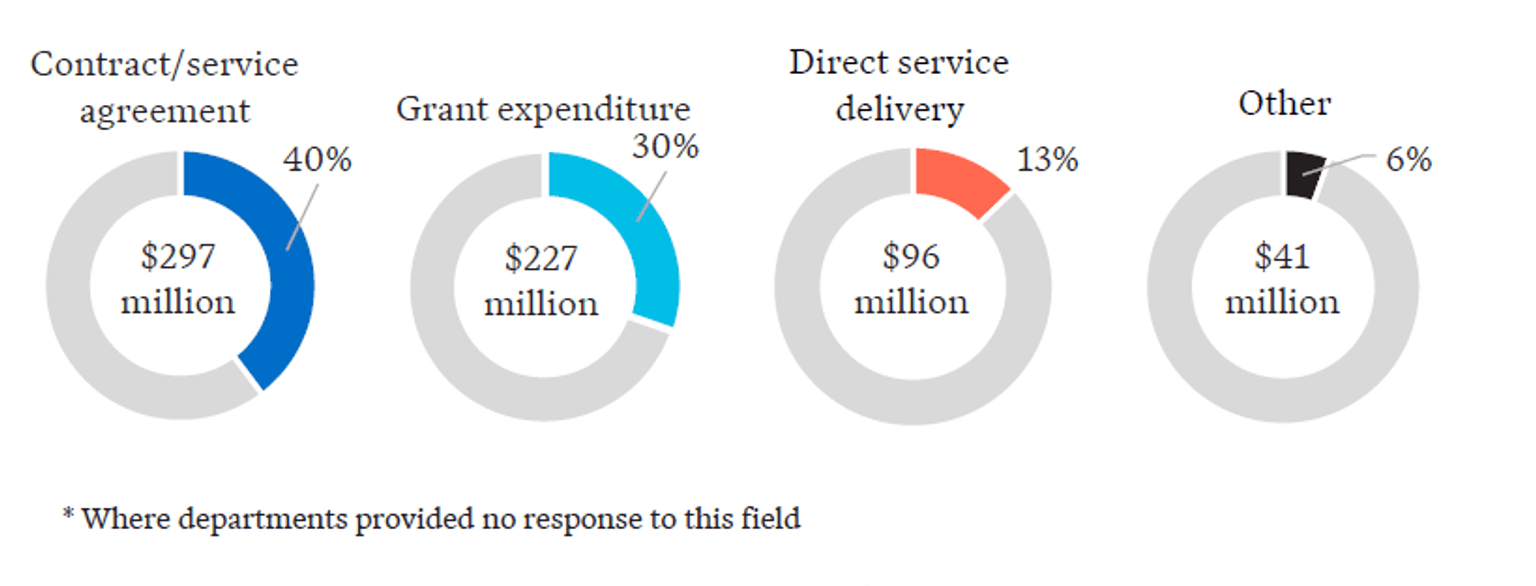
The funding approach was provided for $719M (96%) of the total $747M in expenditure. Types of funding included:
- Contract/service agreement
- Direct service delivery (including salaries)
- Grant expenditure
- Reimbursement/Compensation
- Aboriginal-identified employment
- Other.
$524M (70%) of funding is delivered through contracts, service agreements and grants of which $297M (40%) is delivered through contracts and service agreements.
FY22/23 expenditure by funding approach

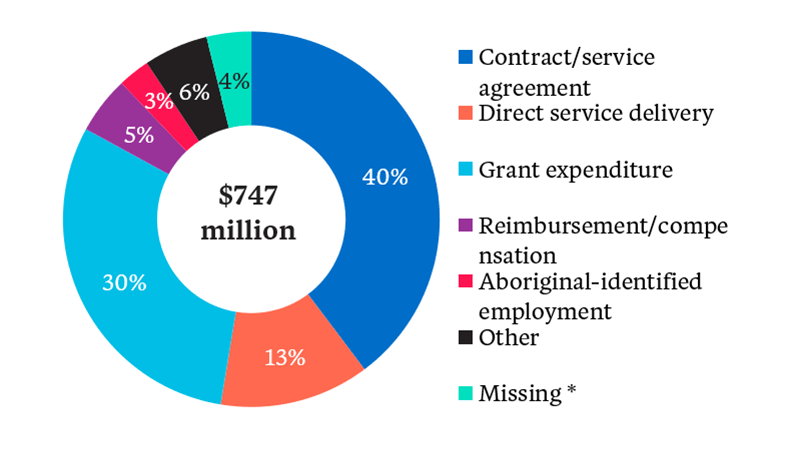
FY22/23 expenditure by funding approach
Updated