

Overview of expenditure
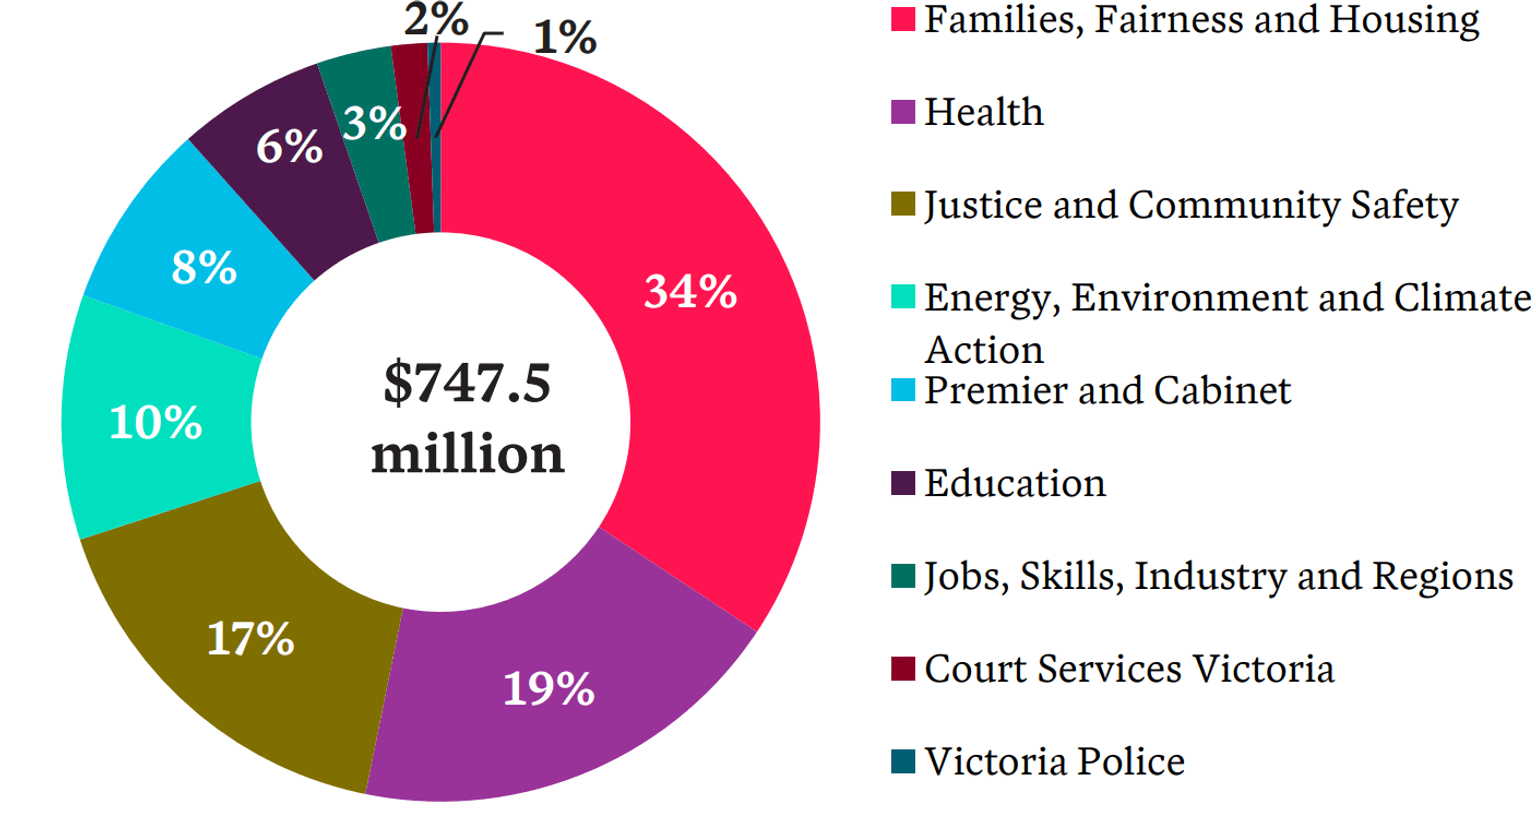
For FY22/23, the forecast First Peoples-specific expenditure is $747 million.
The four largest departments by total expenditure in FY22/23 are:
- Families, Fairness and Housing
- Health
- Justice and Community Safety
- Energy, Environment and Climate Action
For other departments total expenditure is $148M, including:
- Premier and Cabinet $59M
- Education $47M
- Jobs, Skills, Industry and Regions $24M
- Court Services Victoria $11M.
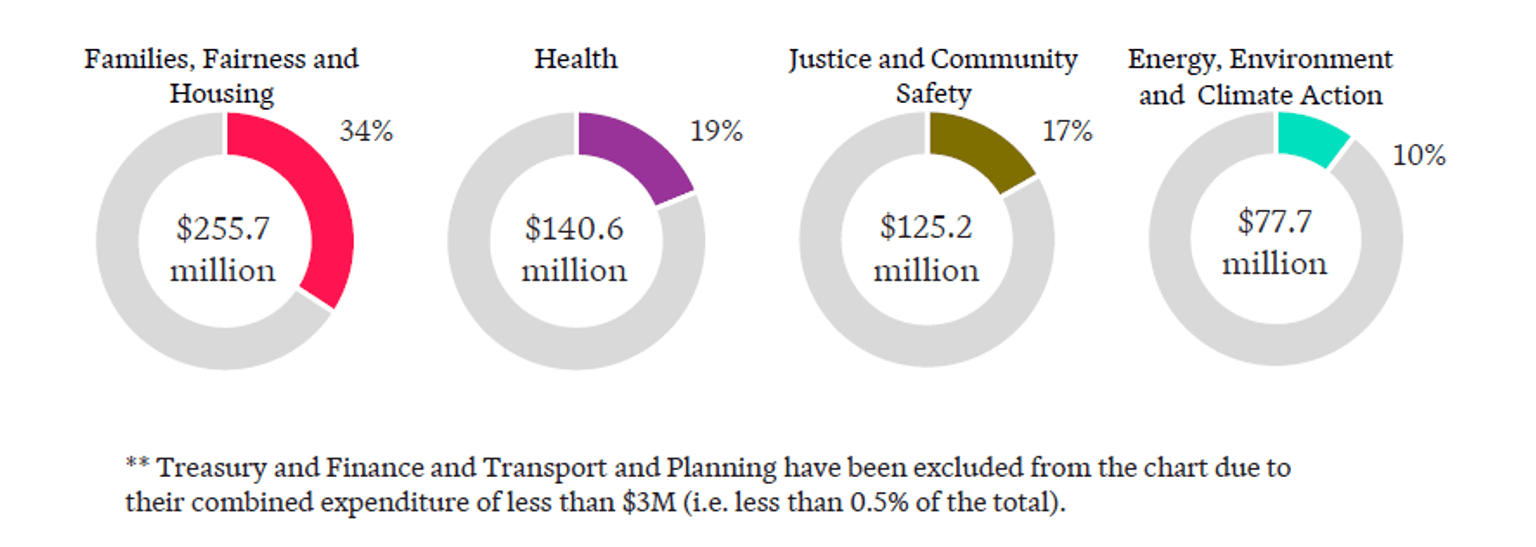
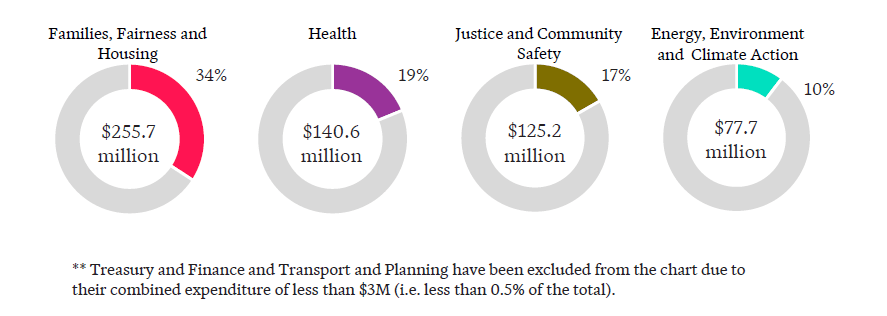
Expenditure in FY22/23 by lead department
Expenditure in FY22/23 by lead department
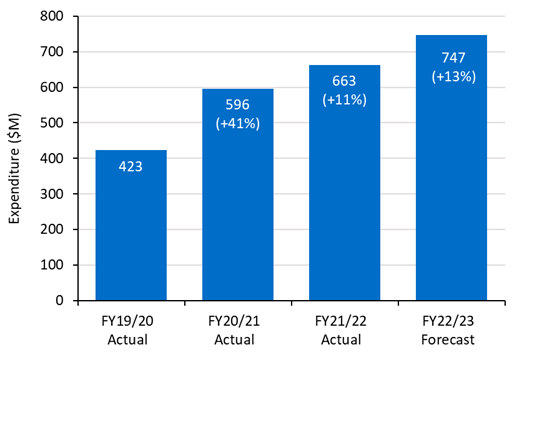
Expenditure over time
Targeted expenditure has increased year on year.
- Targeted expenditure grew from $423M in FY19/20 to $747M in FY22/23.
- The growth in targeted expenditure reflects a combination of:
- Growth in total expenditure on services provided to First Peoples.
- A reallocation of expenditure from non-targeted to targeted services. For example, Aboriginal children in the child protection system are increasingly being supported through targeted services, whereas in FY19/20 they were supported through non-targeted services.
- Phase 2 will explore how much of the growth relates to growth in total expenditure vs a reallocation from non-targeted services.
- Analysing the data by financial year:
- Expenditure grew by 41% between FY19/20 and FY20/21. The high rate of growth was driven by relatively large increases in expenditure identified by the Department of Families, Fairness and Housing, the Department of Justice and Community Safety, and the Department of Energy, Environment and Climate Action, as well as some COVID-19 spending measures (see next slide).
- Expenditure grew by 11% and 13% in subsequent years.
Targeted expenditure over time ($M)

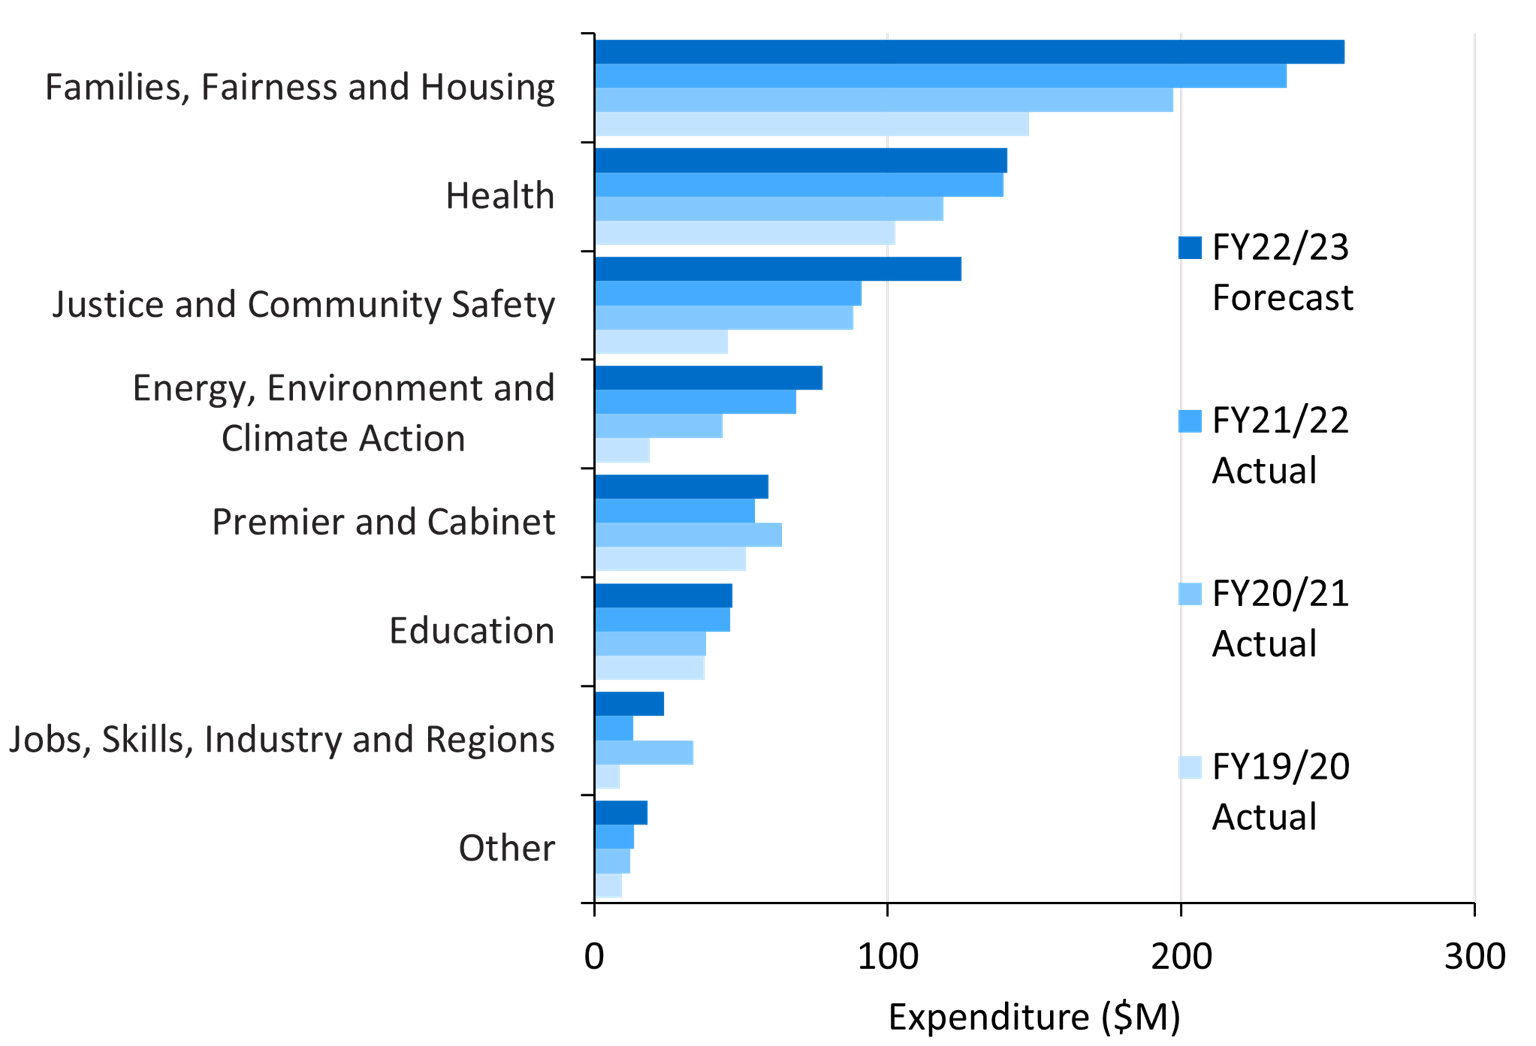
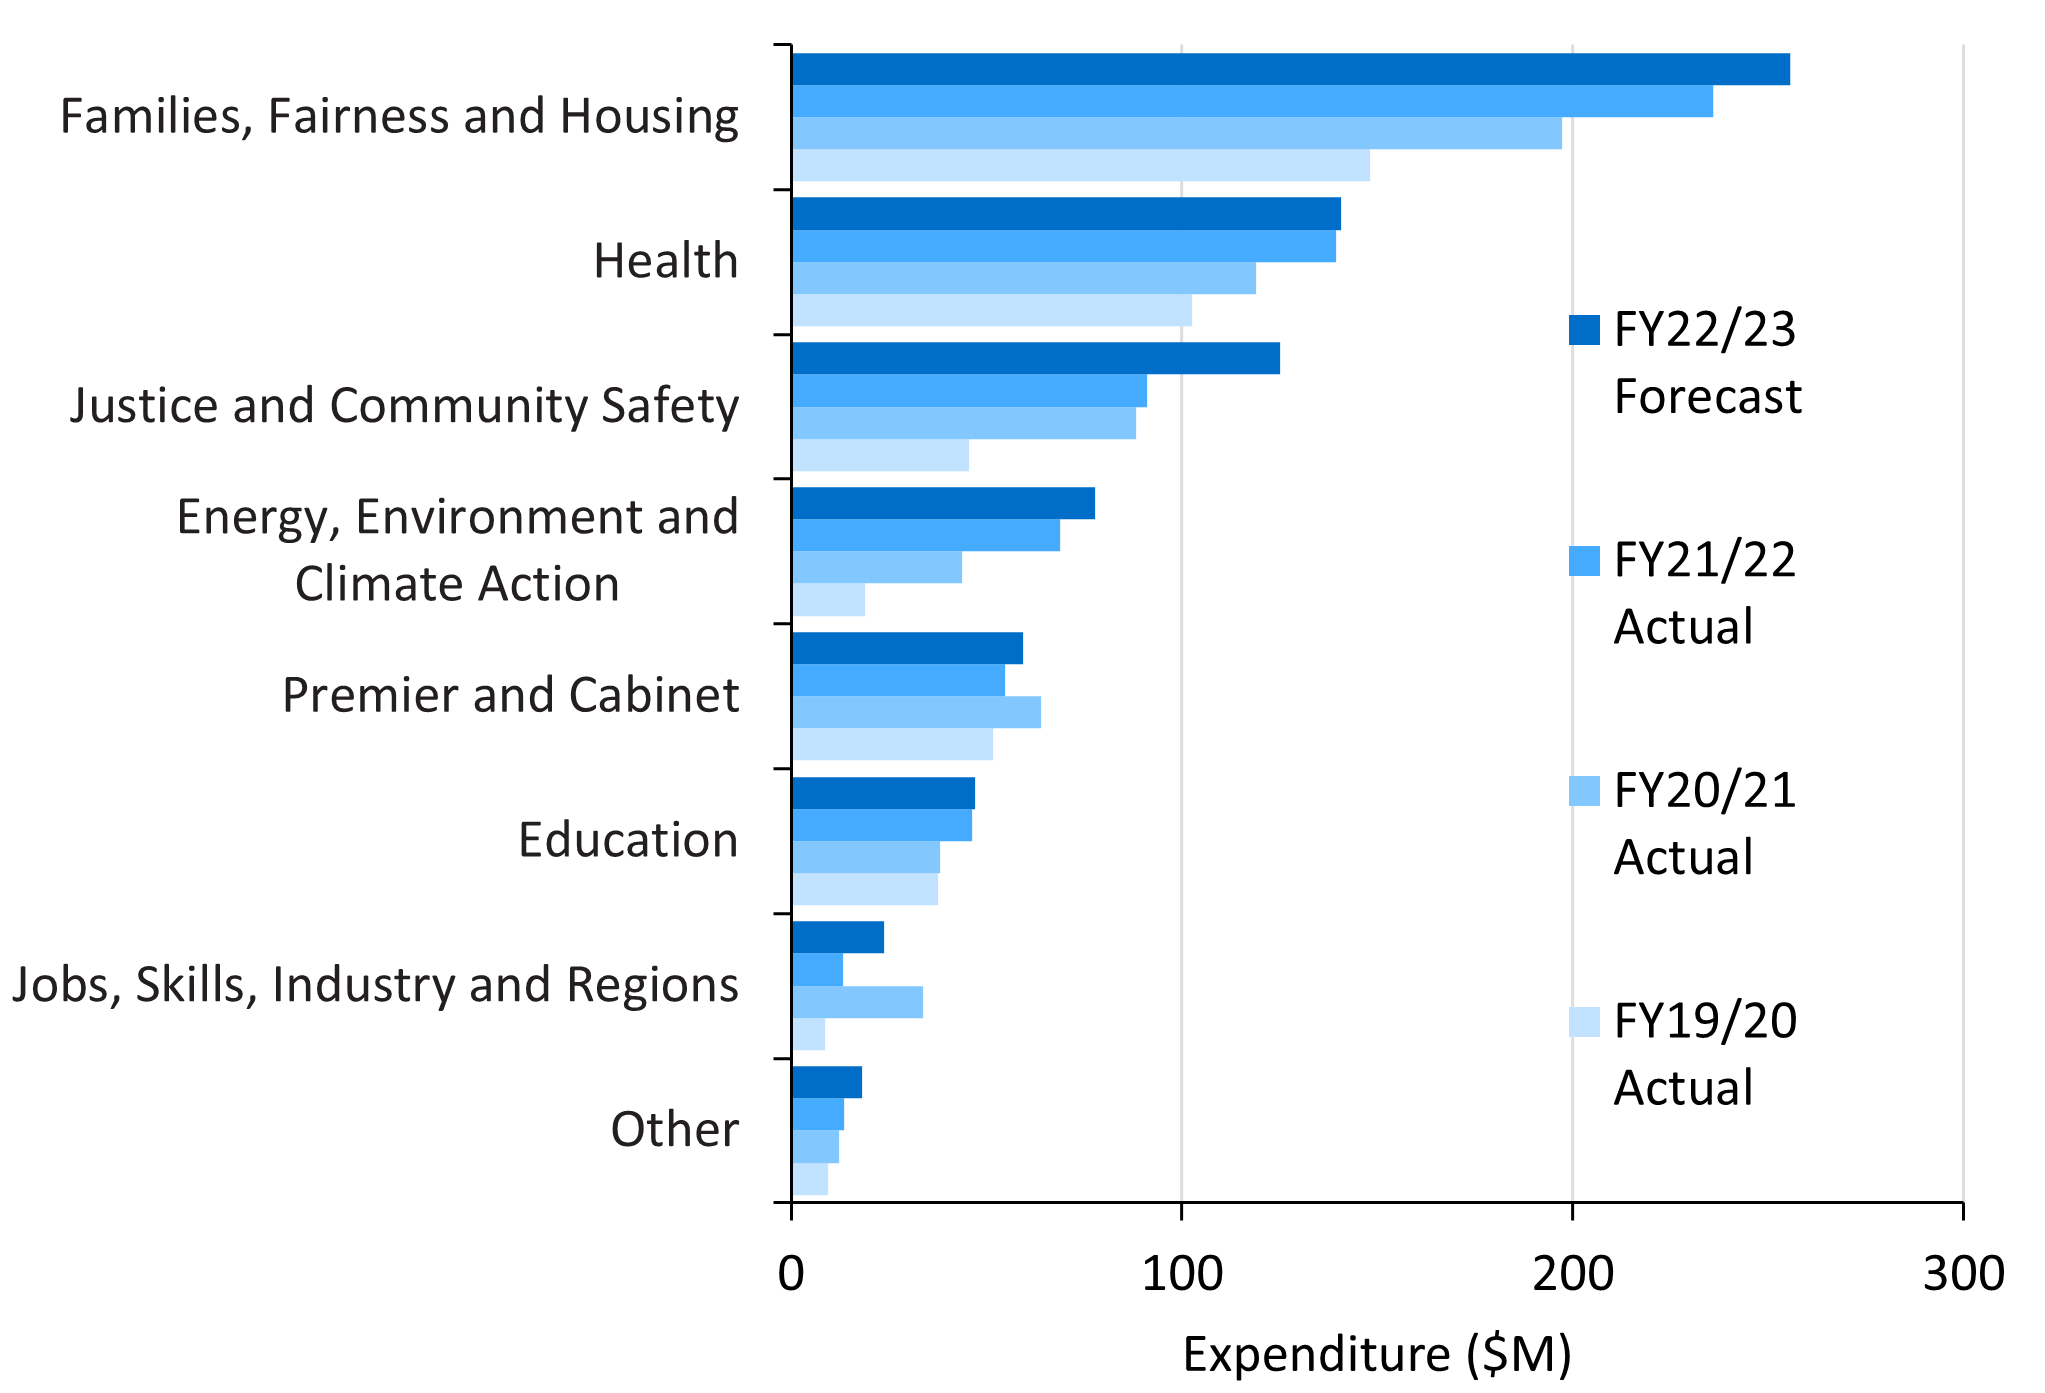
Expenditure growth by departments
Since FY19/20, expenditure has grown across all departments.
- The chart shows that the largest areas of growth between FY19/20 and FY22/23 were:
- Families, Fairness and Housing – expenditure grew from $148M to $256M (+$107M)
- Health – expenditure grew from $103M to $139M (+$33M)
- Justice and Community Safety – expenditure grew from $46M to $125M (+$79M)
- Energy, Environment and Climate Action – expenditure grew from $19M to $78M (+$59M).
- A one-off COVID-19 related $18.5M program caused a spike in Jobs, Skills, Industry and Regions expenditure in FY20/21.
Targeted expenditure over time, by lead department ($M)
Updated