

Overview
This section presents more detailed results for each department contributing to the report.
The results include expenditure from the departments themselves.
The results separate the expenditure of Victoria Police and Court Services Victoria as they report their data separately to the Department of Justice and Community Safety.
Machinery of government changes took place during the period considered in this report. The most significant of these was the division of the Department of Health and Human Services into the Department of Health and Department of Families, Fairness and Housing in 2020-21. The results reported reflect the current 2022-23 Victorian Government structure – for example, the data shows what total expenditure for the Department of Health would have been if it had been a separate department in 2020-21.
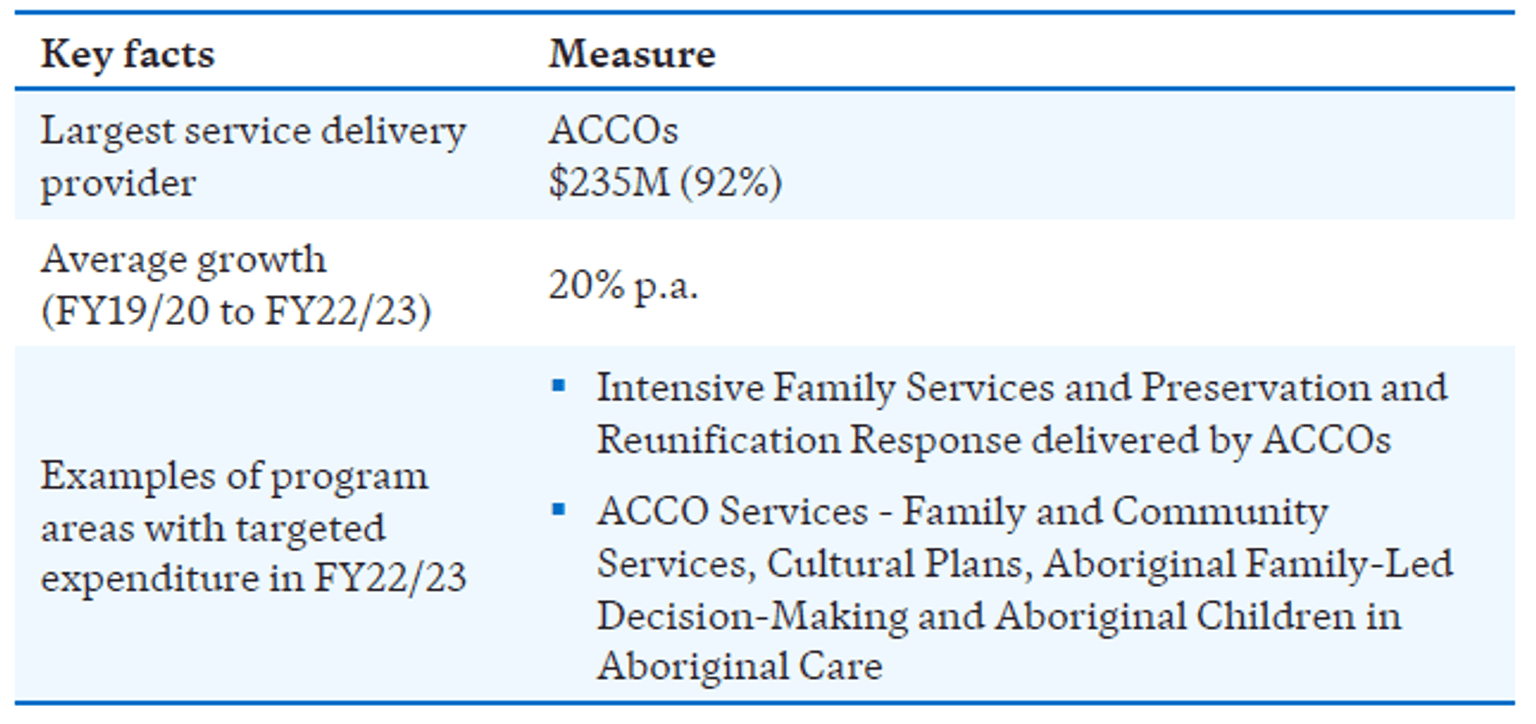
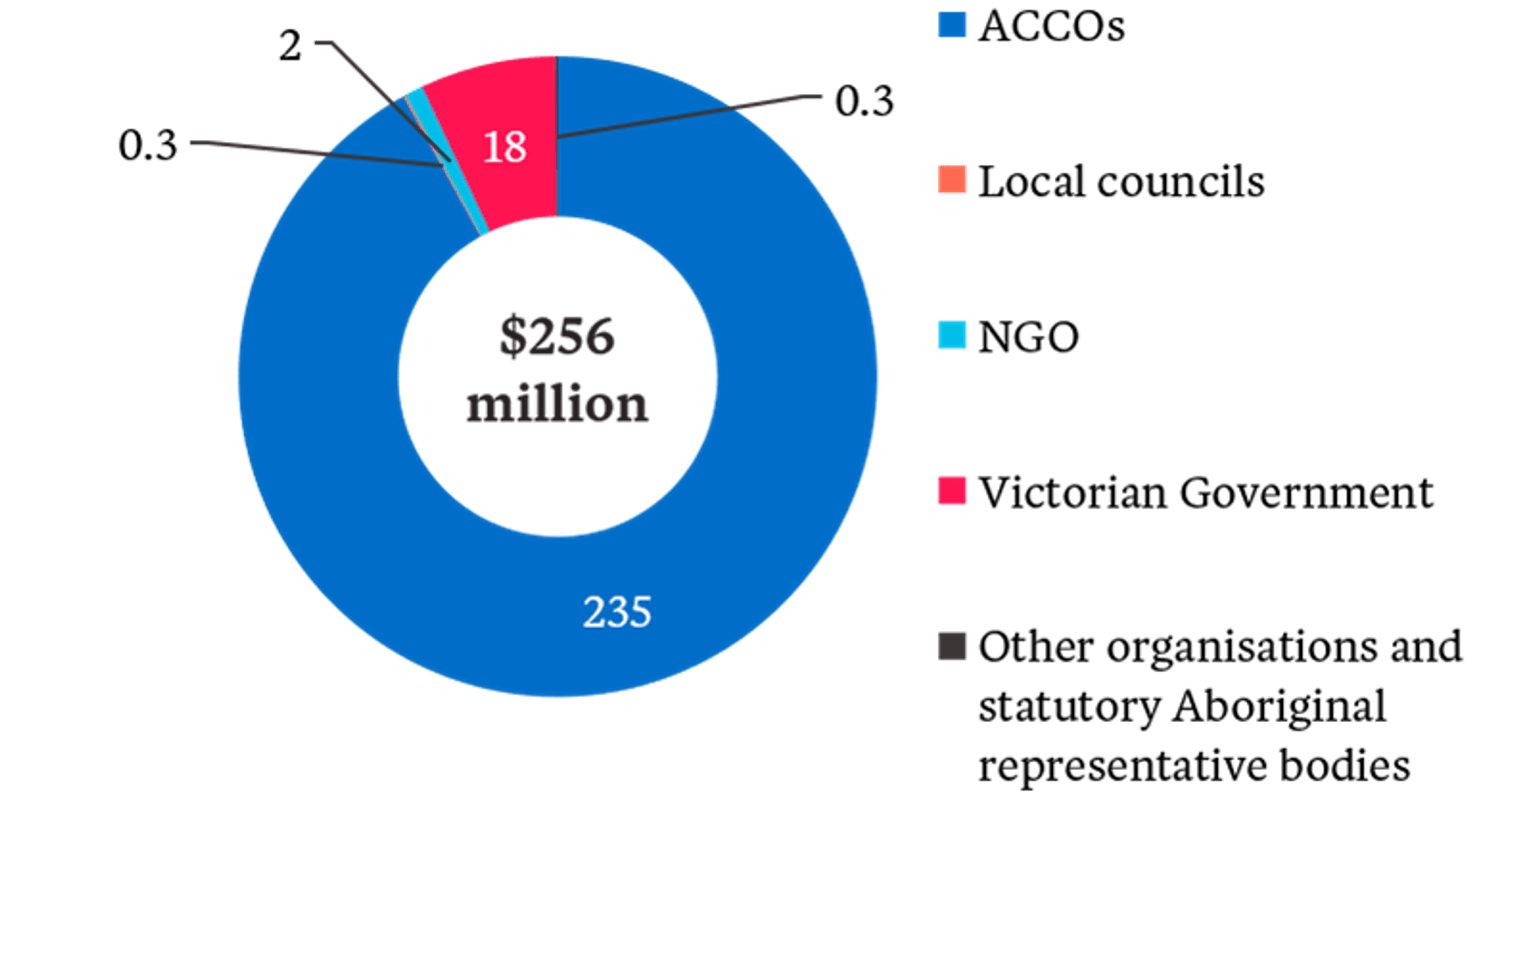
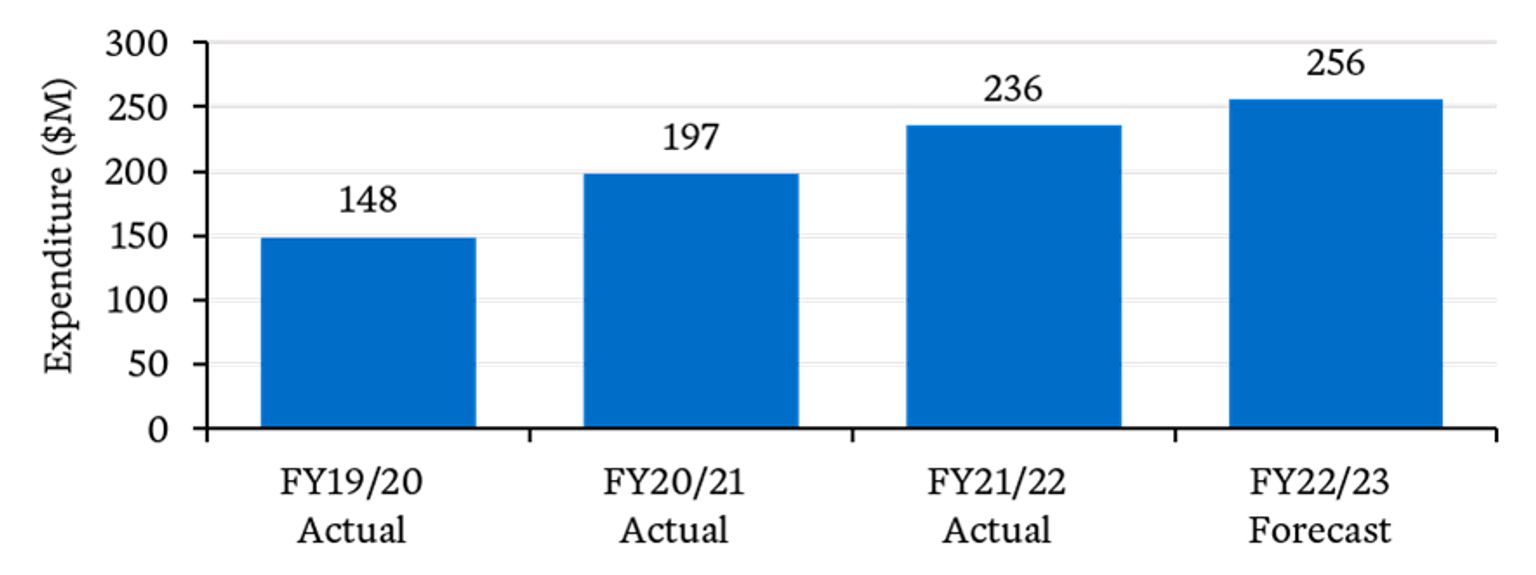
Department of Families, Fairness and Housing
Department of Families, Fairness and Housing expenditure increased from $148M in FY19/20 to $256M in FY22/23 (+107M).
- Growth in expenditure is high across all years, particularly between FY19/20 and FY20/21.
- There is high growth in targeted expenditure across a range of programs, including Family and Community Services, Family Violence Responses and The Orange Door.
- Almost all of the department’s targeted expenditure is delivered through ACCOs.
Key facts
FY22/23 targeted expenditure by service provider type ($M)
Targeted expenditure over time ($M)
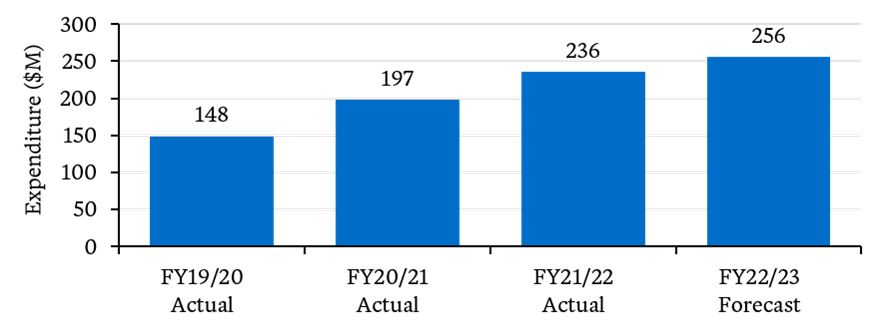
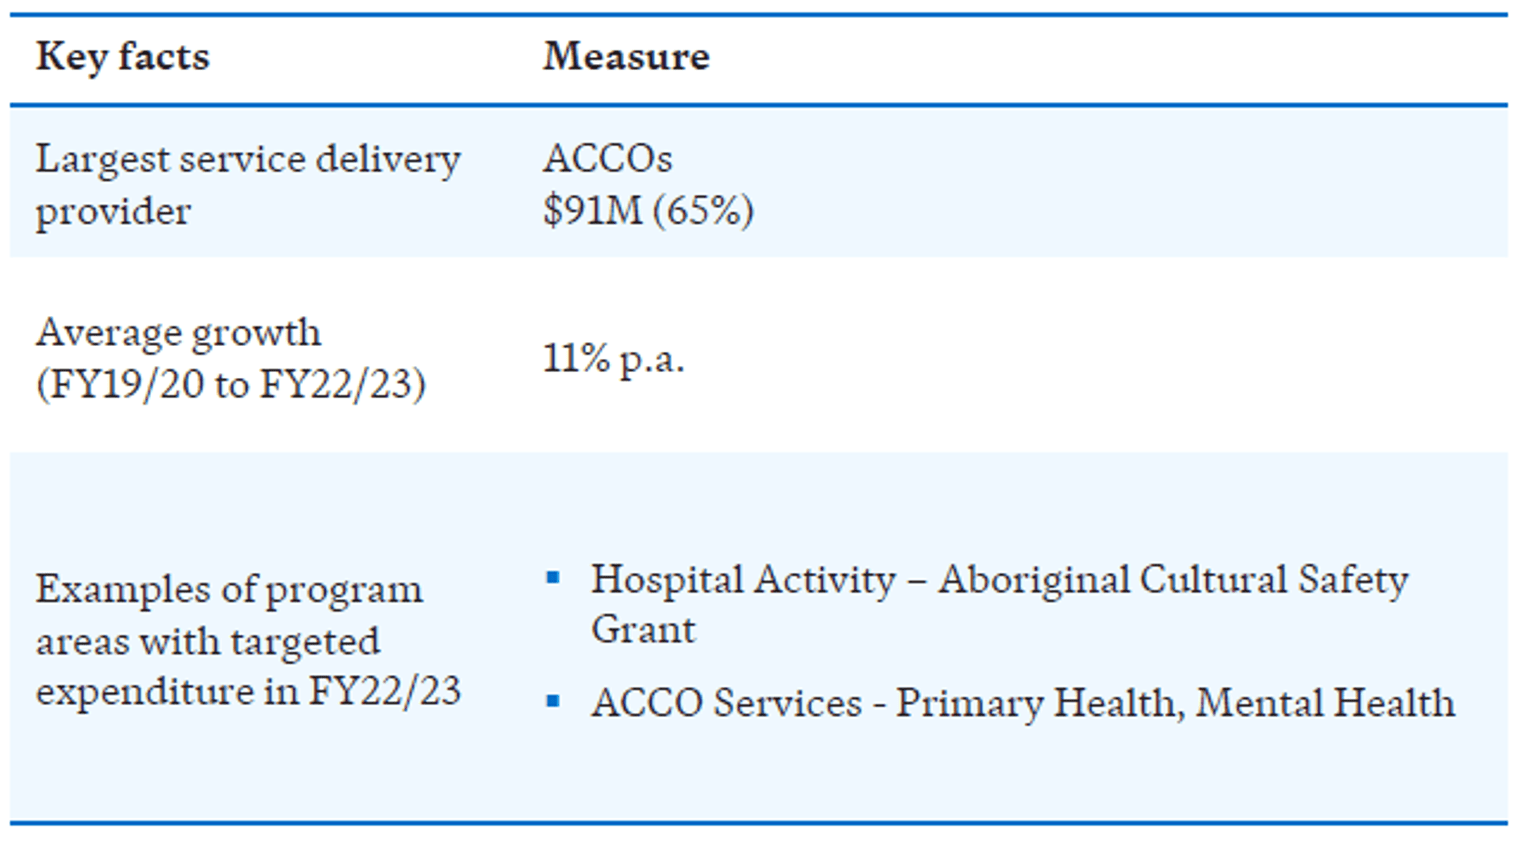
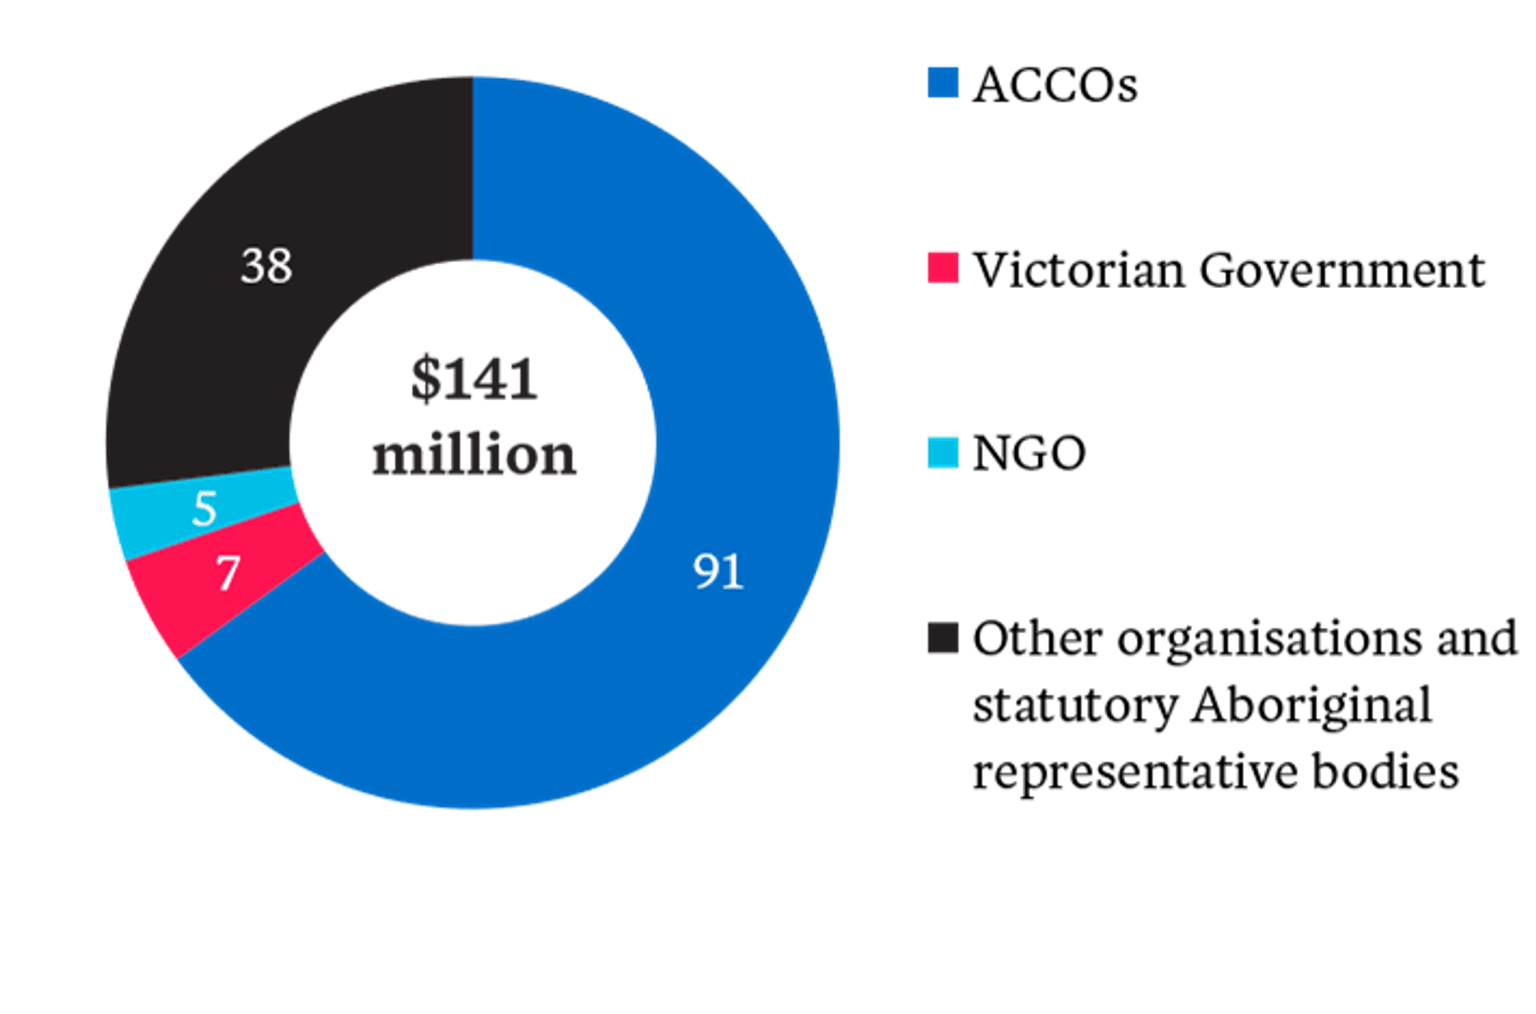
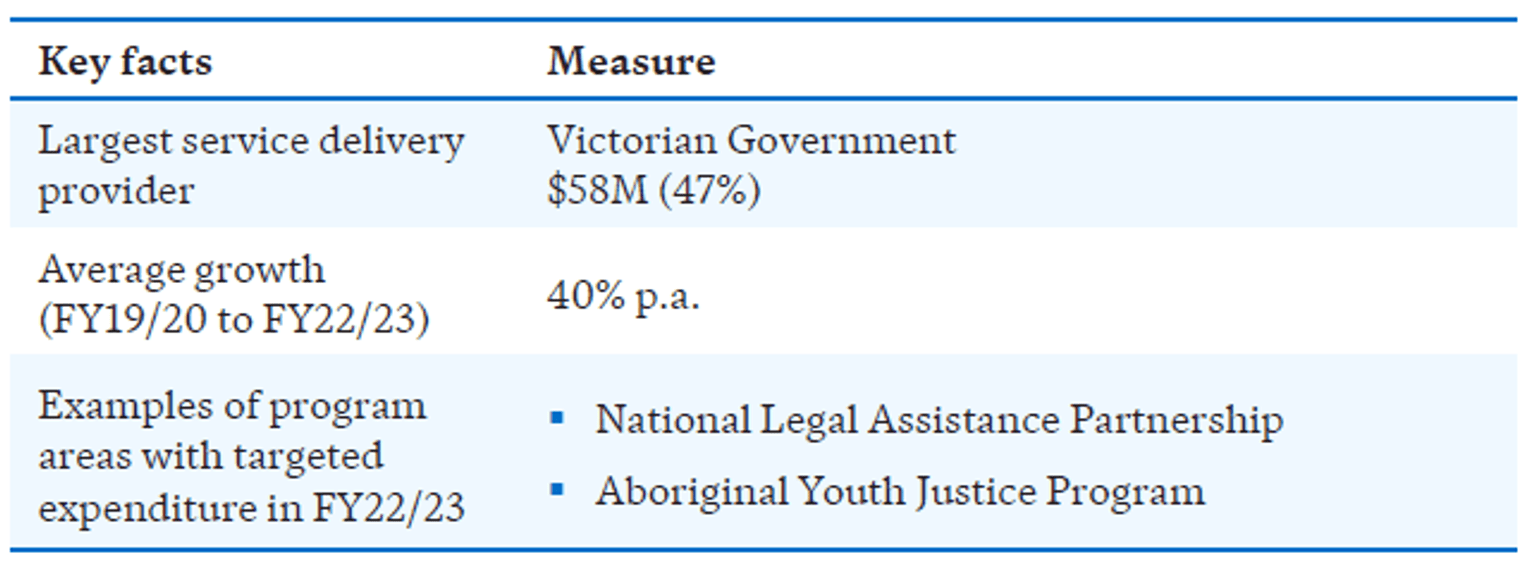
Department of Health
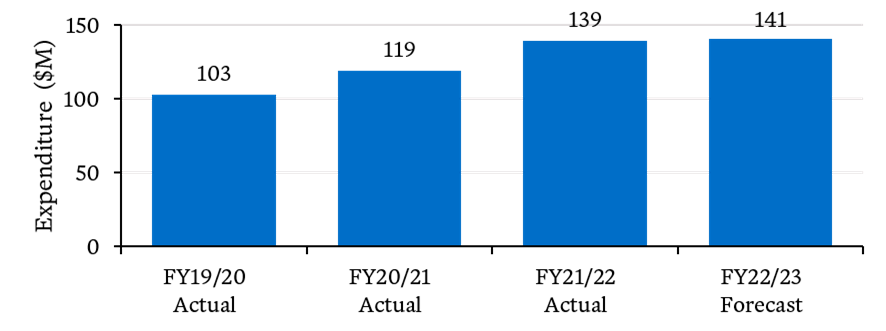
Department of Health expenditure increased from $103M in FY19/20 to $141M in FY22/23 (+38M).
- Growth in expenditure is high across a range of programs. Examples include Primary Care, Mental Health and Drug Services provided through ACCOs, and Aboriginal Maternal and Child Health.
- Most of the department’s targeted expenditure is provided by ACCOs ($91M). Of the $38M provided by an ‘Other organisations and statutory Aboriginal representative bodies’ service provider, the vast majority relates to funding for hospitals under the Aboriginal Cultural Safety Grant program.
Key facts
FY22/23 targeted expenditure by service provider type ($M)
Targeted expenditure over time ($M)

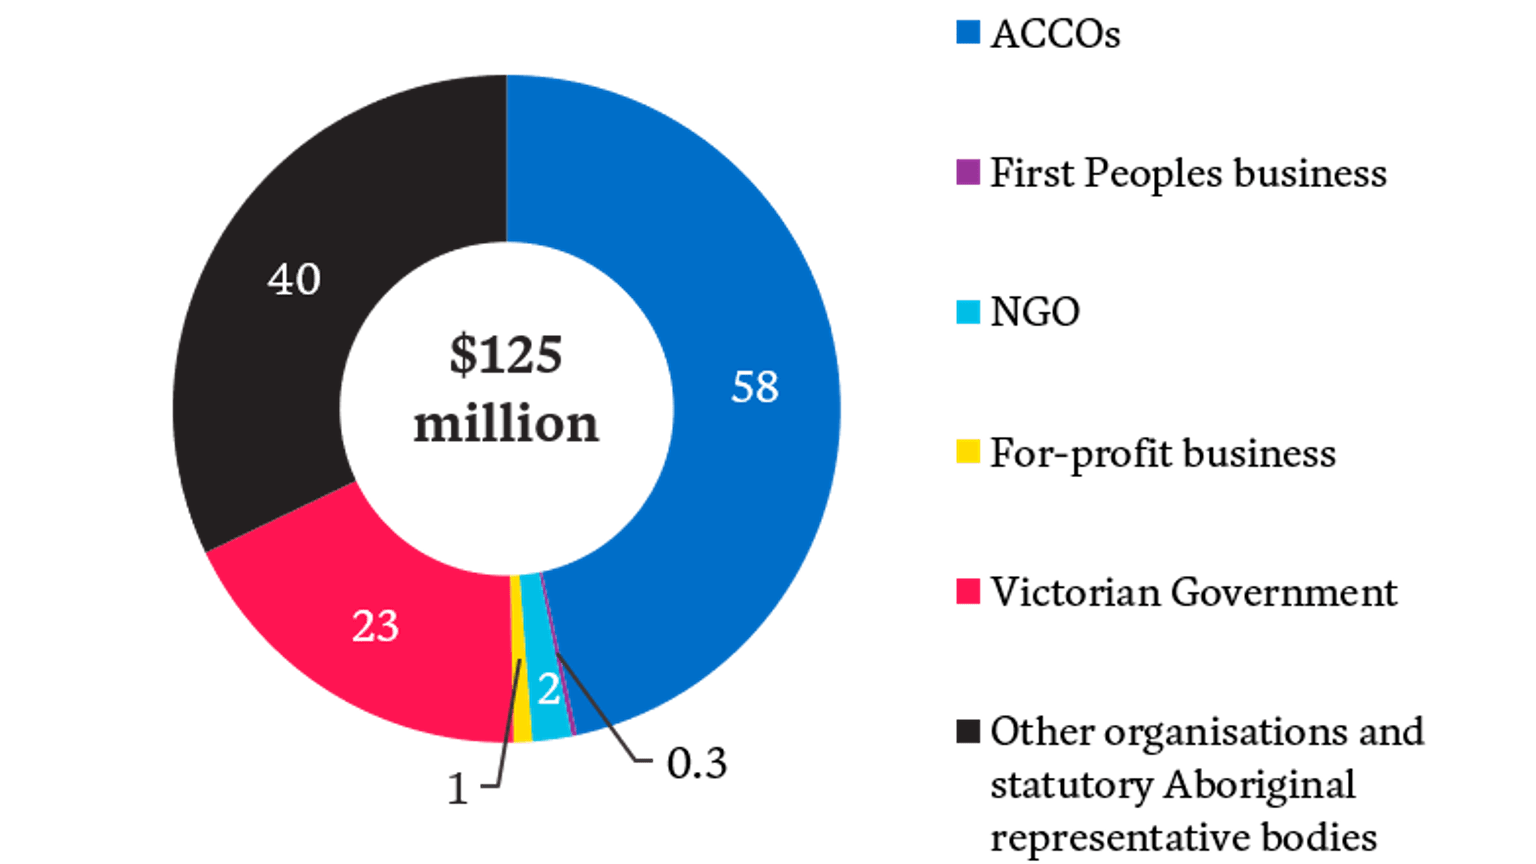
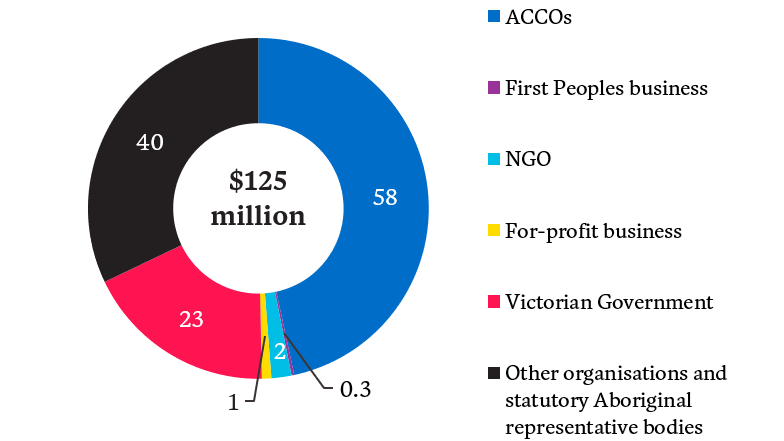
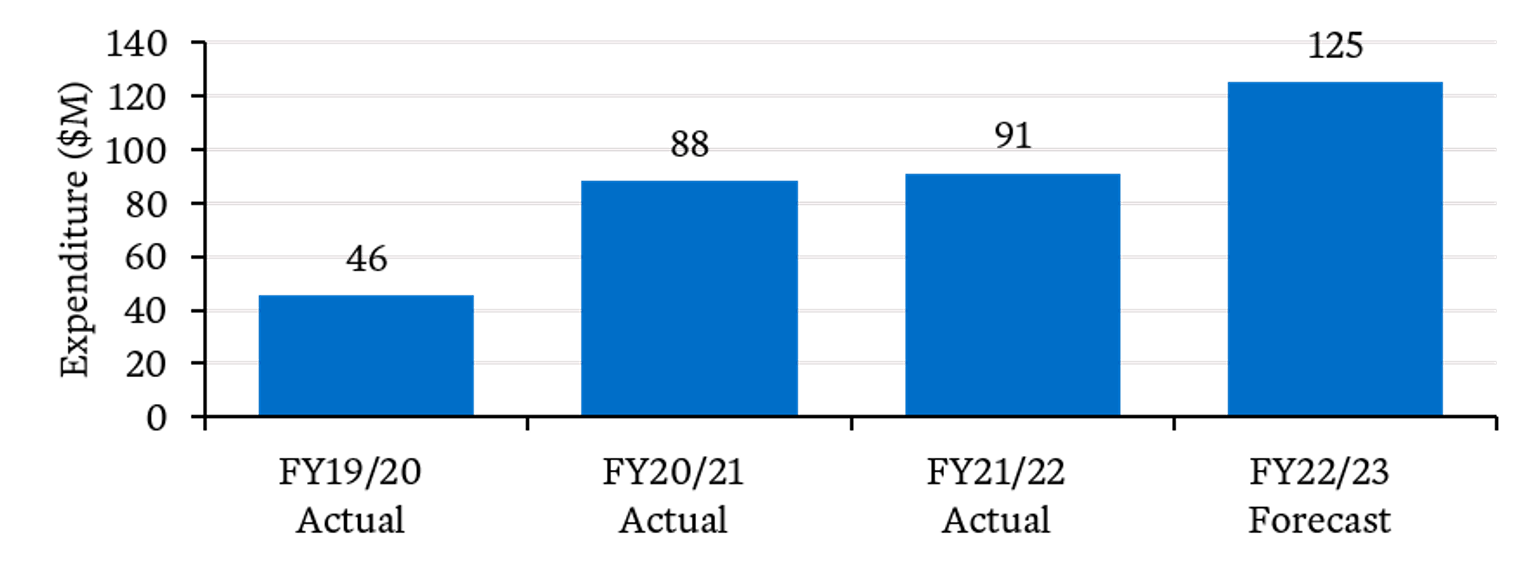
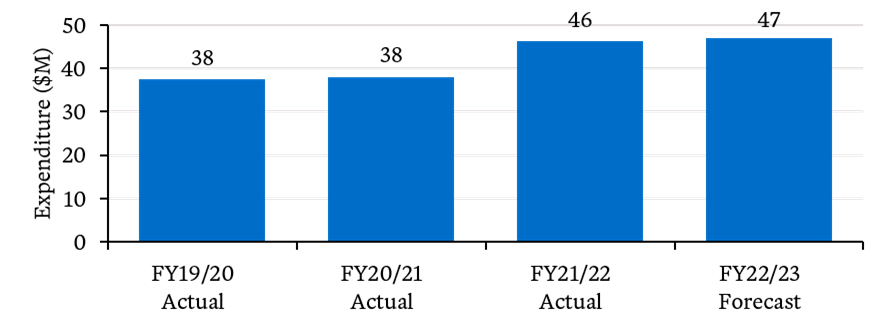
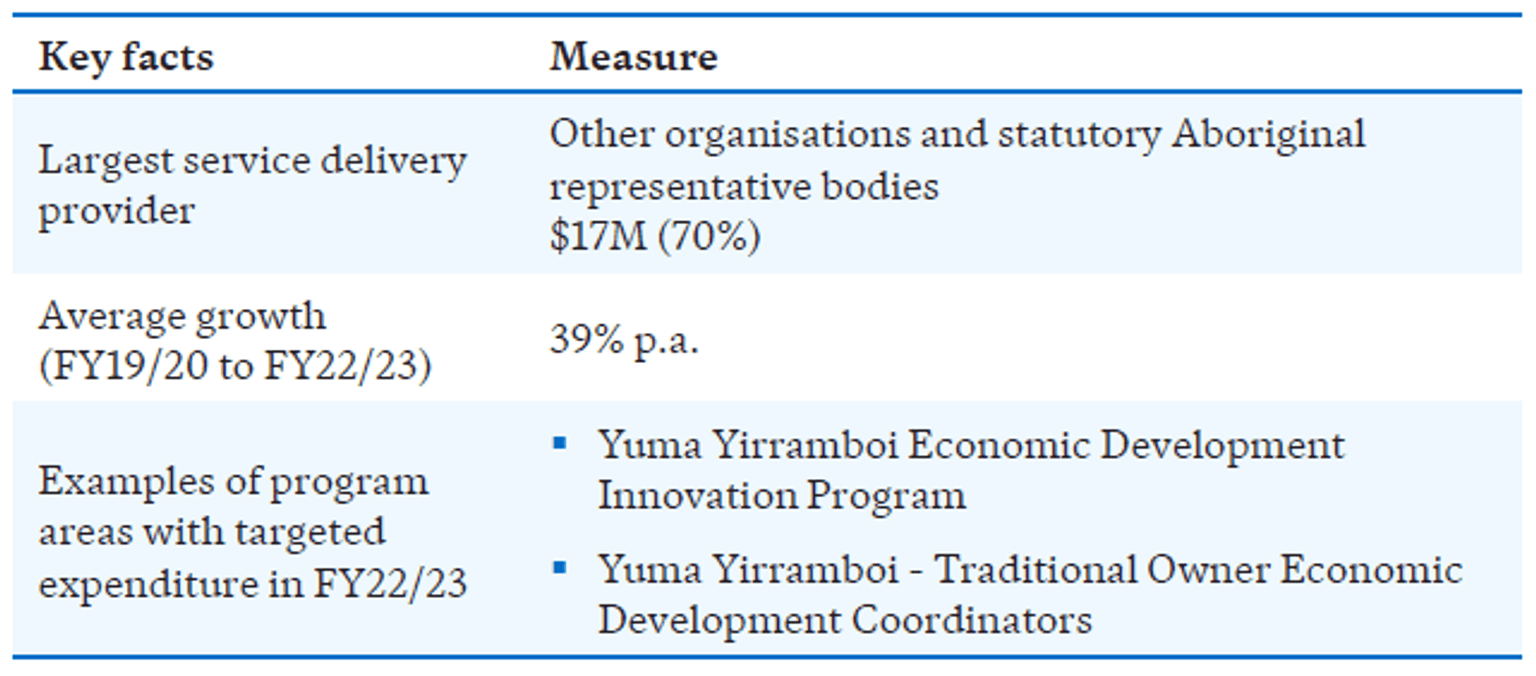
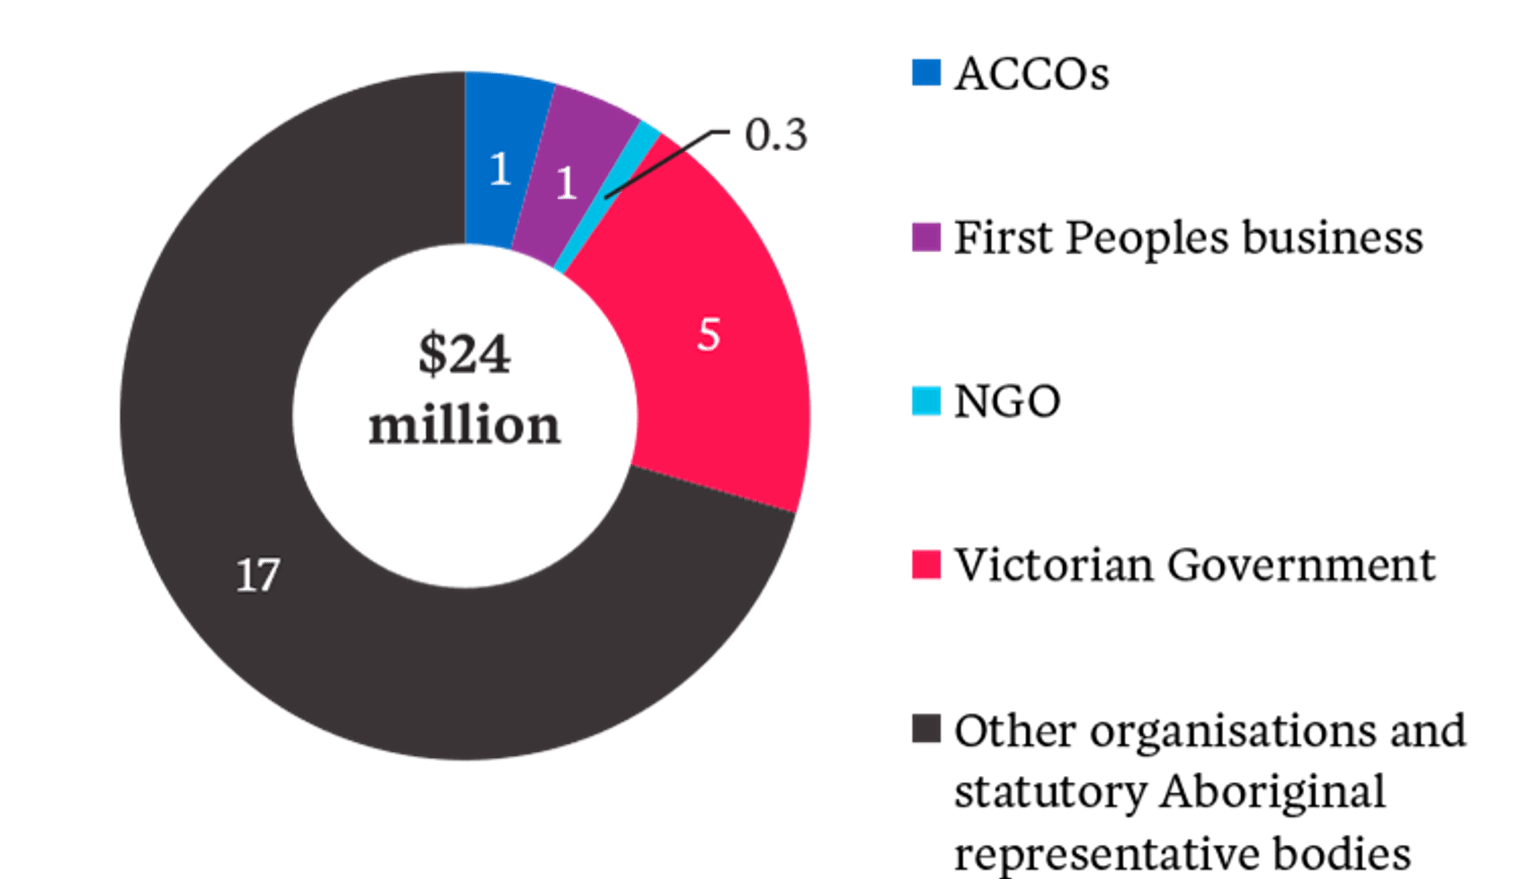
Department of Justice and Community Safety
Department of Justice and Community Safety spend grew from $46M in FY19/20 to $125M in FY22/23 (+$79M).
- Targeted expenditure for the Department of Justice and Community Safety does not include data from Court Services Victoria or Victoria Police which are presented separately.
- Land Justice expenditure is included here due to being included under the Department of Justice and Community Safety for most of the period considered. It is now part of the Department of Premier and Cabinet.
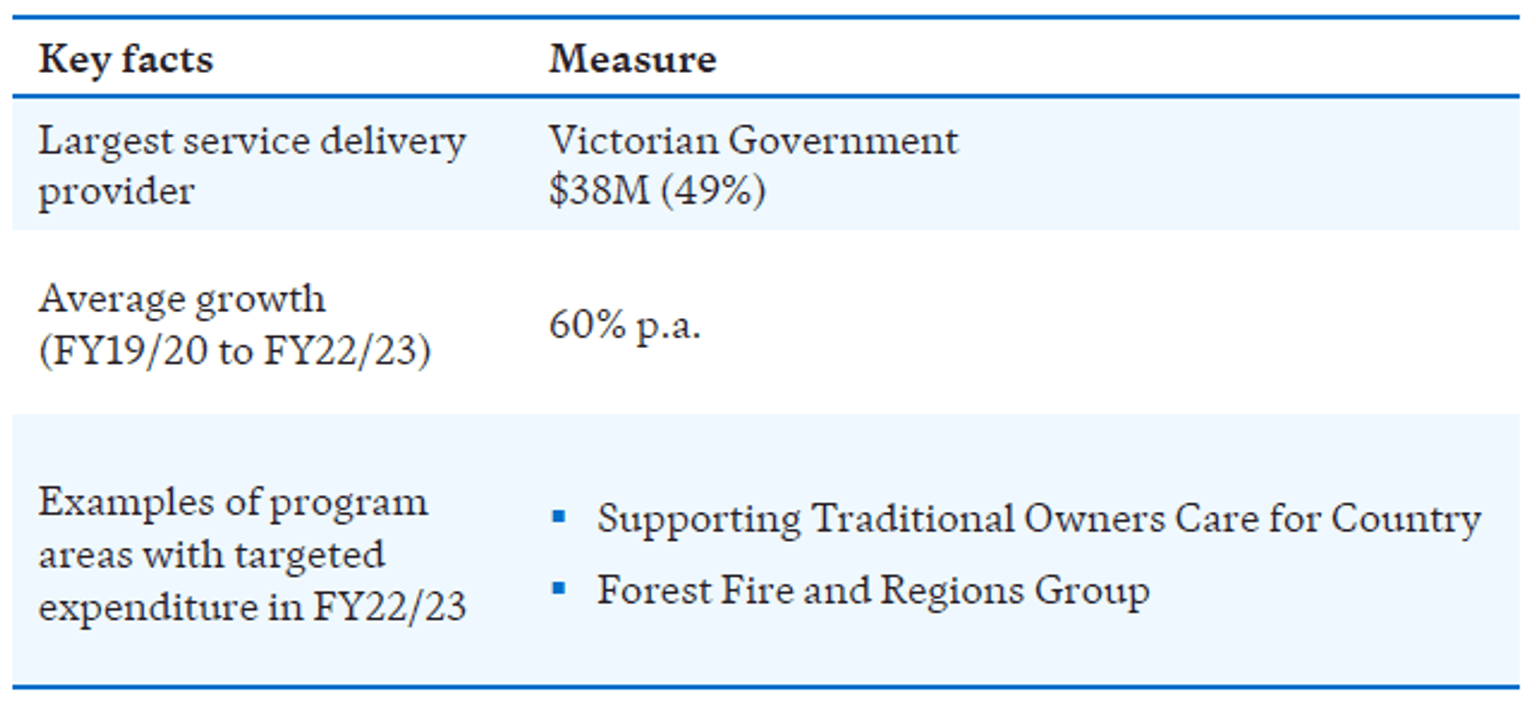
- There is high growth in expenditure from FY19/20 to FY20/21 and FY21/22 to FY22/23. Contributing significantly to the increase in expenditure is the implementation of Stolen Generations Reparations Payments, which had applications opened in March 2022, with $36M of expenditure in FY22/23, compared to $0.5M in FY21/22.
Please note: after the publication of this report, an error was identified in the below ‘Key facts’ table. The largest service delivery provider in the ‘Measure’ column should read ‘ACCOs’ instead of ‘Victorian Government’. As reflected in the pie chart further below, Victoria’s 2023 Expenditure Review Targeted Expenditure report found that ACCOs were the largest service delivery provider in terms of targeted expenditure for the Department of Justice and Community Safety in the 2022-23 financial year.
Key facts
FY22/23 targeted expenditure by service provider type ($M)
Targeted expenditure over time ($M)
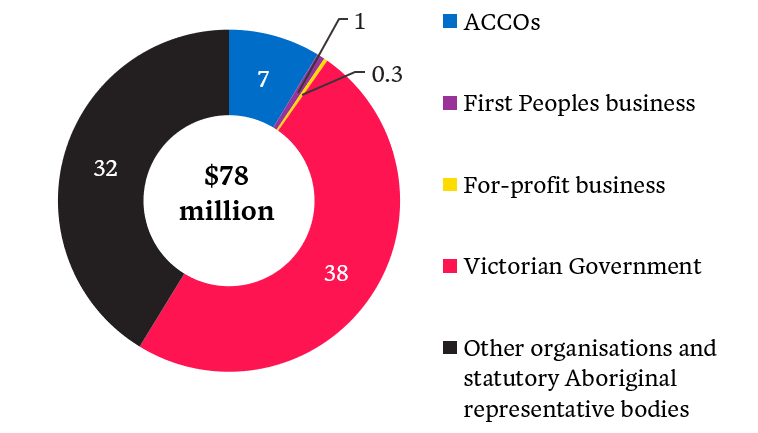
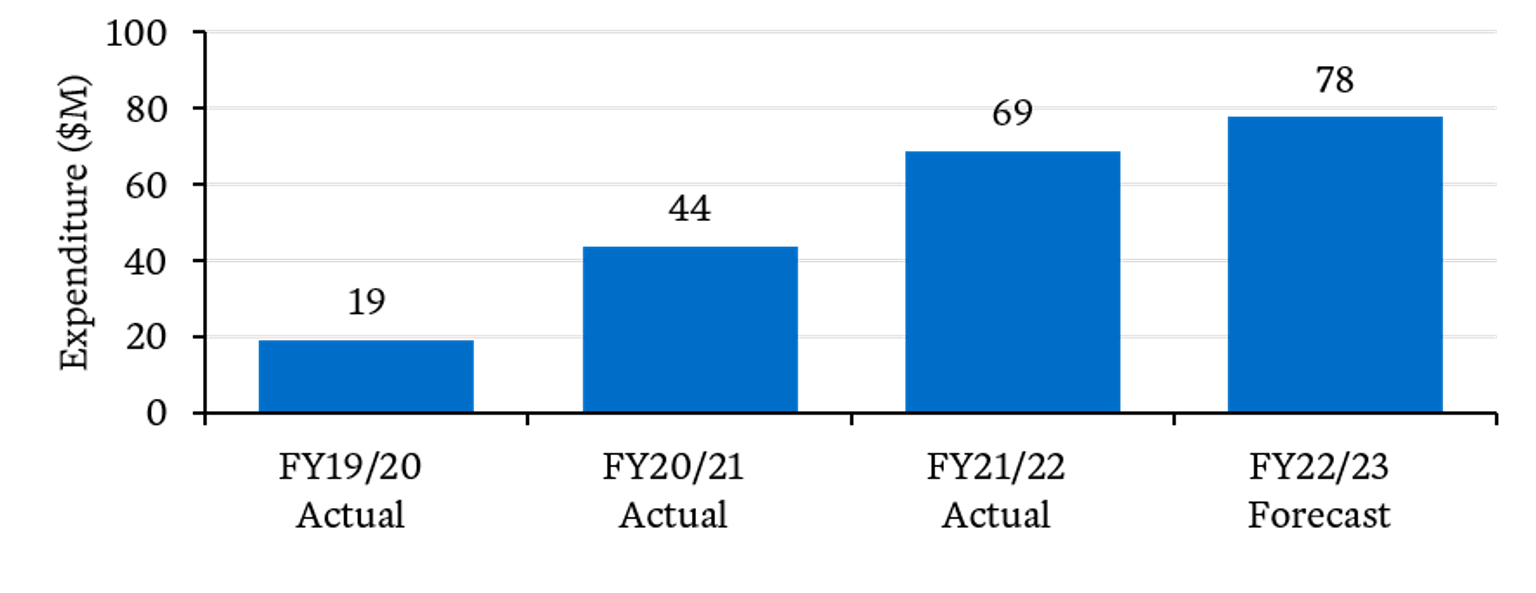
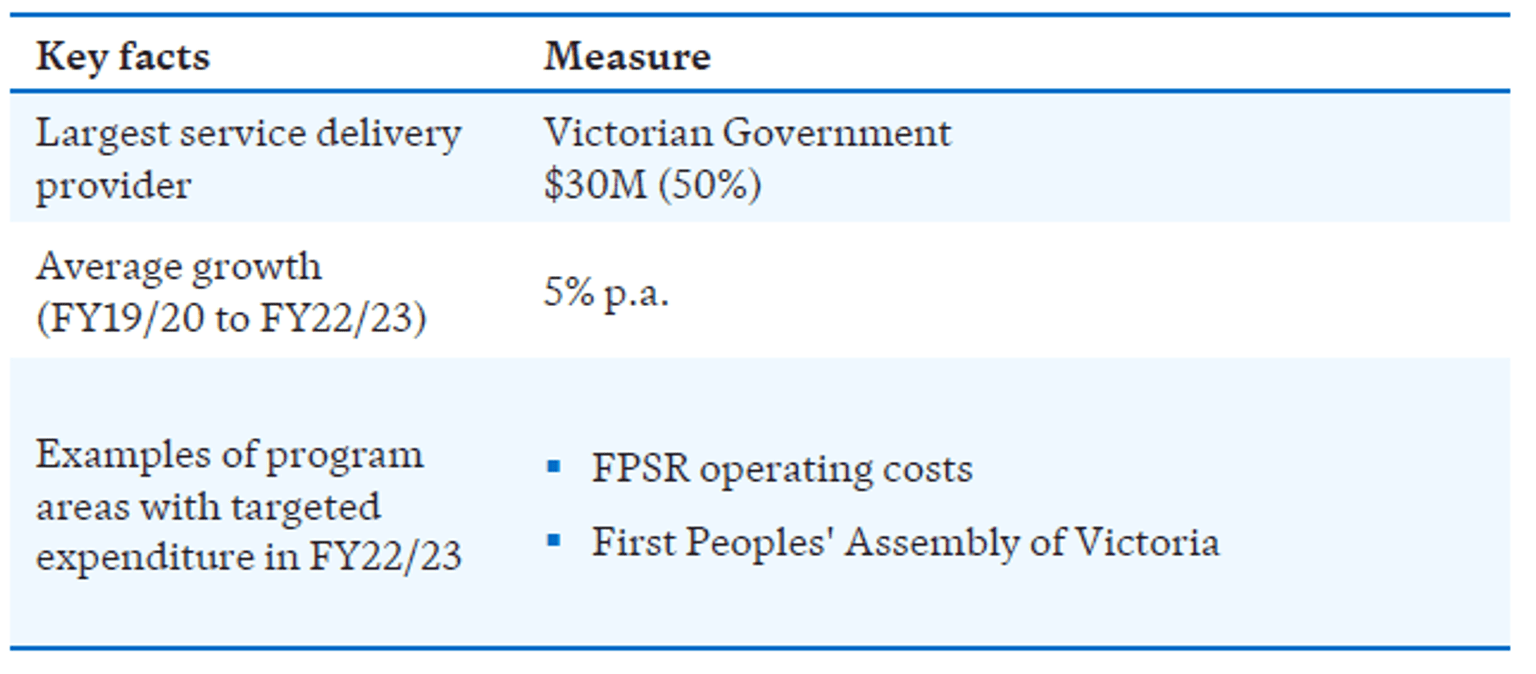
Department of Energy, Environment and Climate Action
Department of Energy, Environment and Climate Action expenditure increased from $19M in FY19/20 to $78M in FY22/23 (+59M).
- The Department of Energy, Environment and Climate Action has the fastest growing targeted expenditure of all departments (60% p.a.). The rapid growth in expenditure was driven by the launch of the Pupangarli Marnmarnepu ‘Owning our Future’ – Aboriginal Self-Determination Reform Strategy in August 2020.
- Just over half of the department’s targeted expenditure is delivered by the Victorian Government. ‘Other organisations and statutory Aboriginal representative bodies’ services are mostly delivered through Traditional Owner Corporations.
Key facts
FY22/23 targeted expenditure by service provider type ($M)

Targeted expenditure over time ($M)
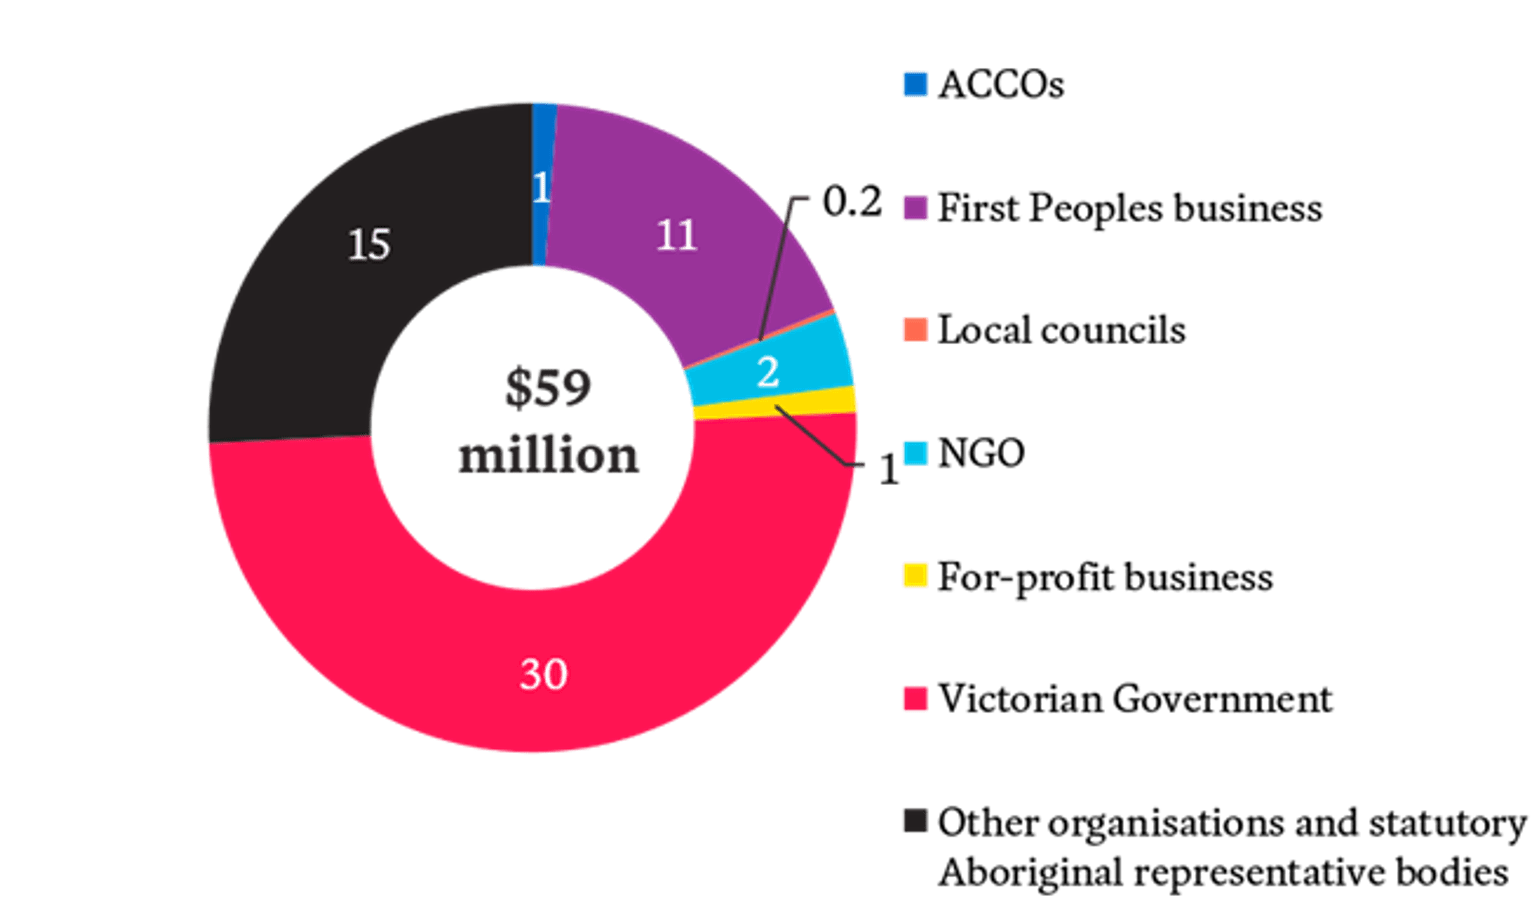
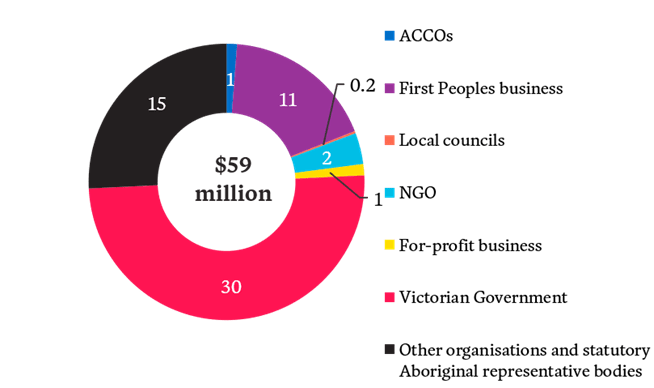
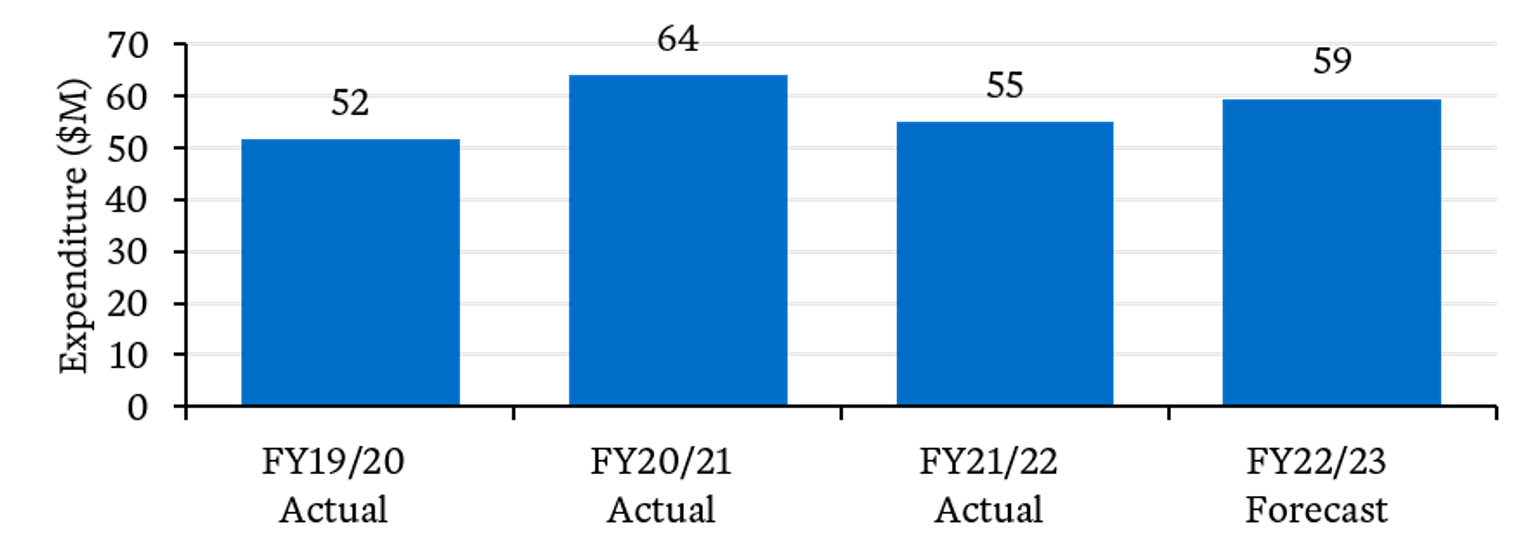
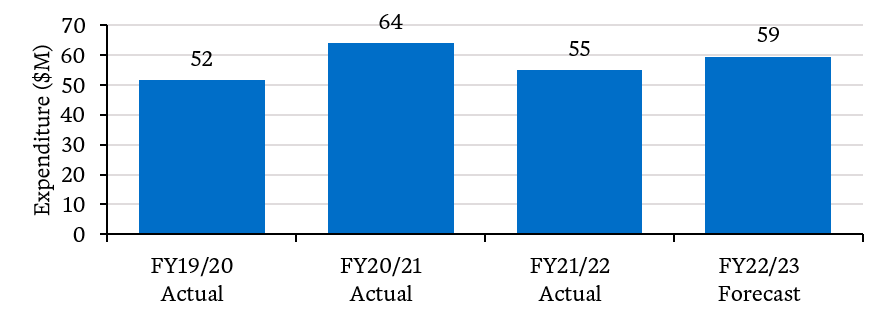
Department of Premier and Cabinet
Department of Premier and Cabinet expenditure increased from $52M in FY19/20 to $59M in FY22/23 (+8M).
- Expenditure has increased over the four years considered. This has been driven by First Peoples – State Relations Group (FPSR) operating costs, noting that FPSR are responsible for driving and delivering a large majority of the department’s targeted expenditure.
- Just over half of the department’s targeted expenditure is delivered by the Victorian Government, primarily due to expenditure on FPSR operating costs. Key components of expenditure delivered by ‘Other organisations and statutory Aboriginal representative bodies’ include funding for First Peoples’ Assembly of Victoria and the Registered Aboriginal Party Operations Program.
Key facts
FY22/23 targeted expenditure by service provider type ($M)
Targeted expenditure over time ($M)
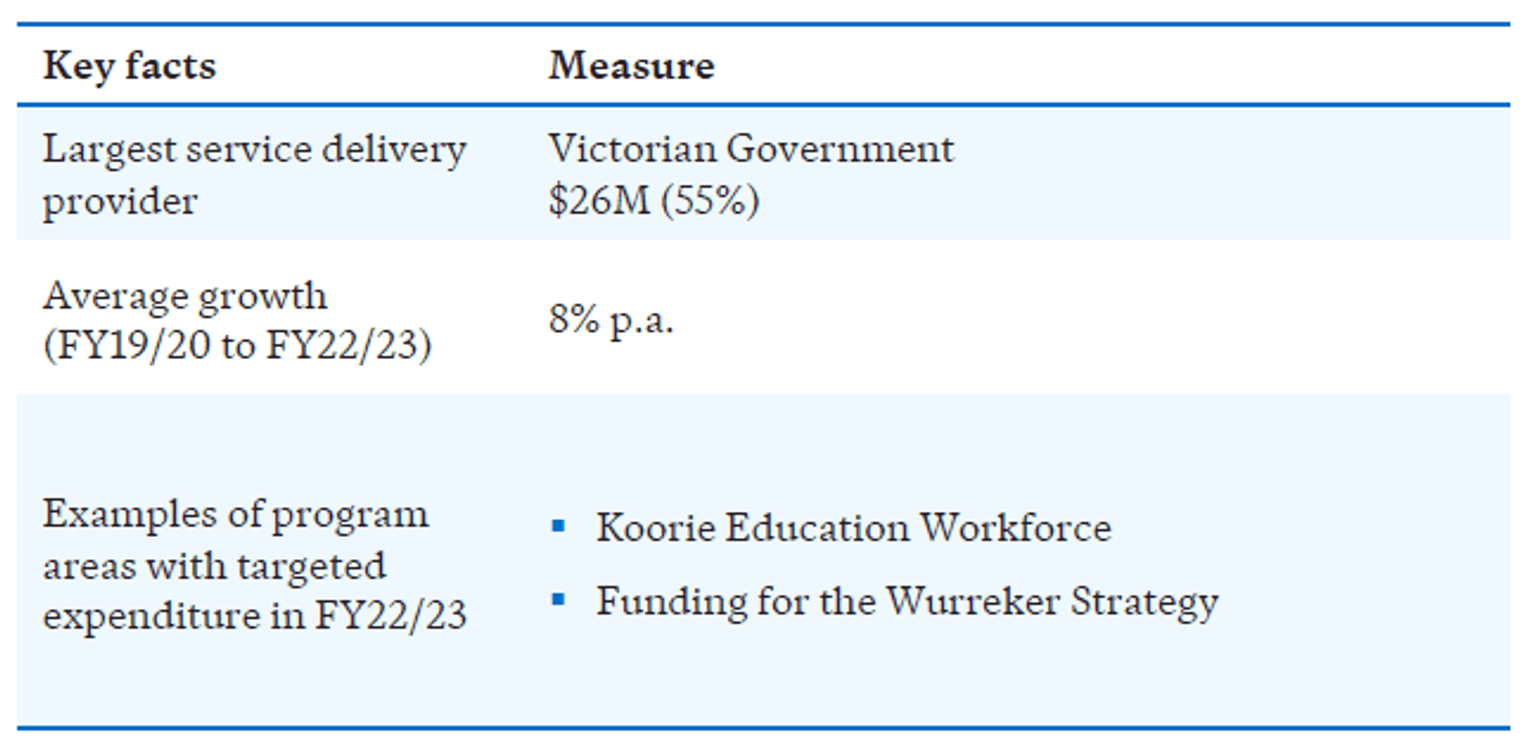
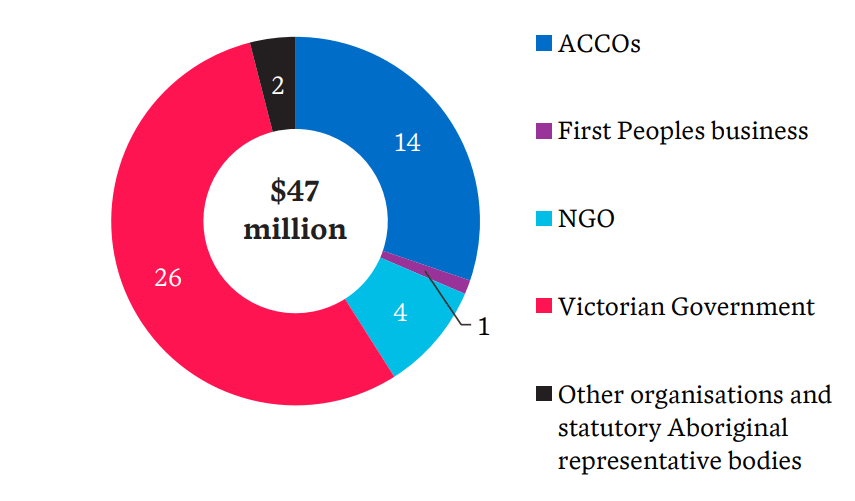
Department of Education
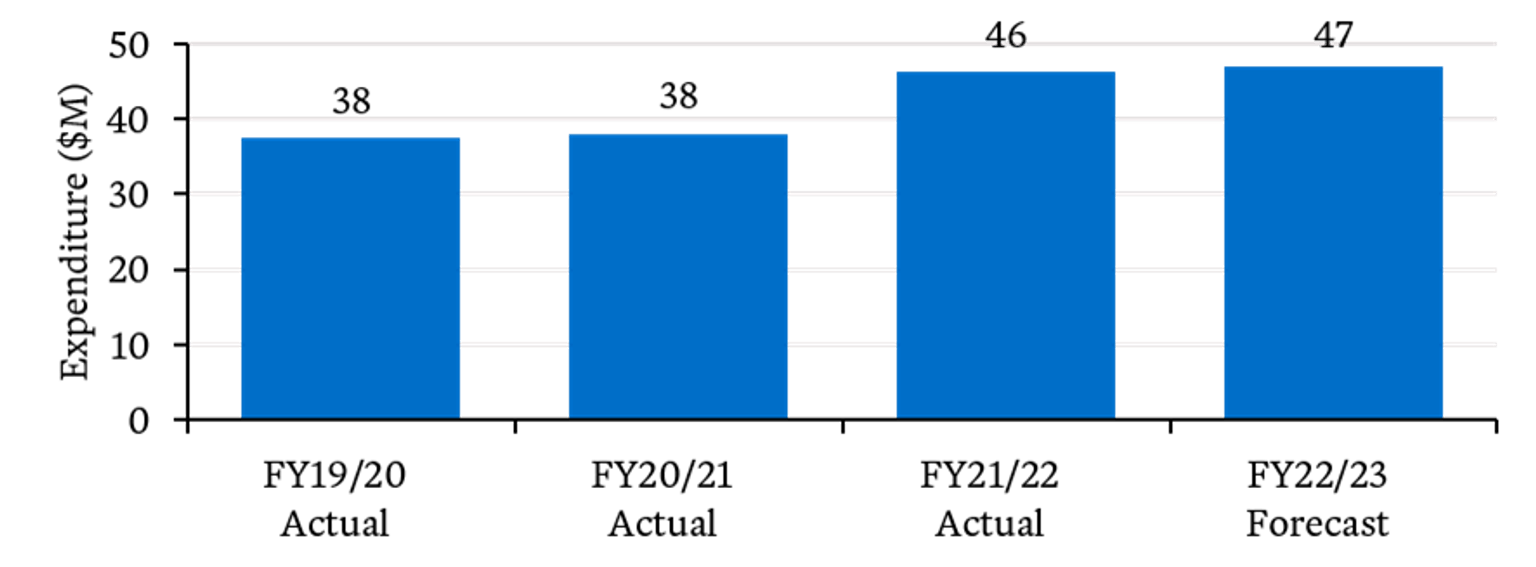
Department of Education expenditure increased from $38M in FY19/20 to $47M in FY22/23 (+10M).
- Expenditure has grown at 8% per year on average.
- Some key drivers of growth include increased expenditure in the Koorie Education Workforce and Balert Gerrbik - Koorie Families as First Educators programs. These are provided by the Victorian Government and ACCOs respectively.
- Just over half of the department’s targeted expenditure is delivered by the Victorian Government. The remainder is mostly delivered through ACCOs and other NGOs.
Key facts
FY22/23 targeted expenditure by service provider type ($M)

Targeted expenditure over time ($M)
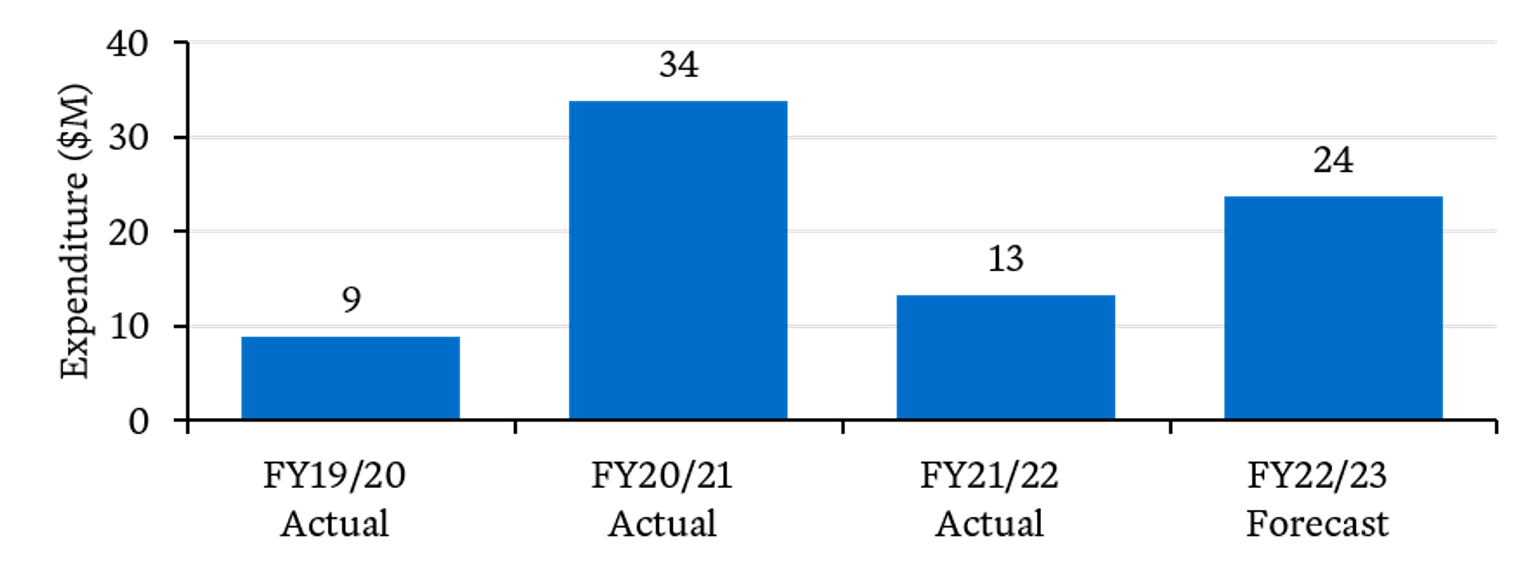
Department of Jobs, Skills, Industry and Regions
Department of Jobs, Skills, Industry and Regions expenditure increased from $9M in FY19/20 to $24M in FY22/23 (+15M).
- Jobs, Skills, Industry and Regions expenditure peaked in FY20/21, coinciding with $18.5M funding for the Working for Victoria initiative. This initiative supported Aboriginal Victorians who had lost their jobs including as a result of COVID-19.
- Targeted expenditure has grown at an average 40% p.a., noting there has been variability observed across years.
- Most of the department’s targeted expenditure is delivered through ‘Other’ service providers. ‘Other organisations and statutory Aboriginal representative bodies’ service provides include Traditional Owner Corporations and other bodies such as universities.
Key facts
FY22/23 targeted expenditure by service provider type ($M)
Targeted expenditure over time ($M)
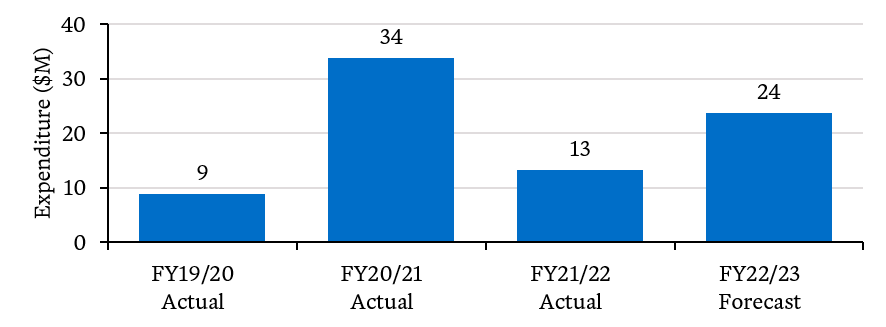
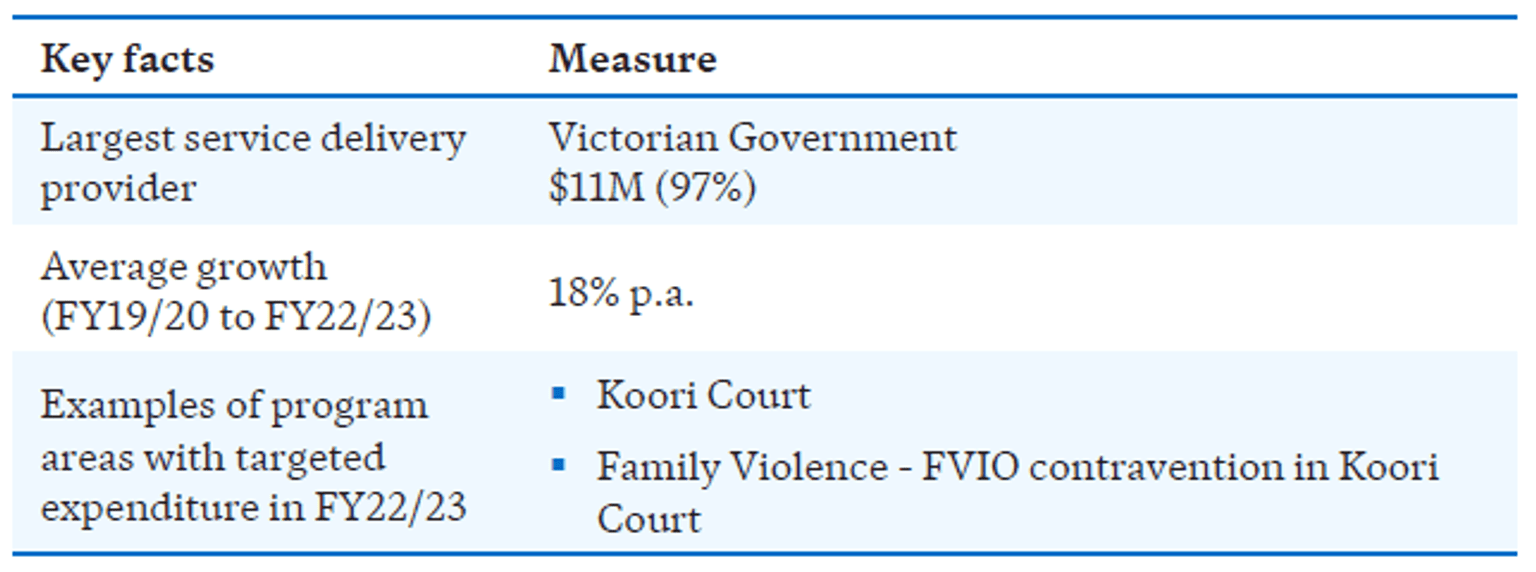
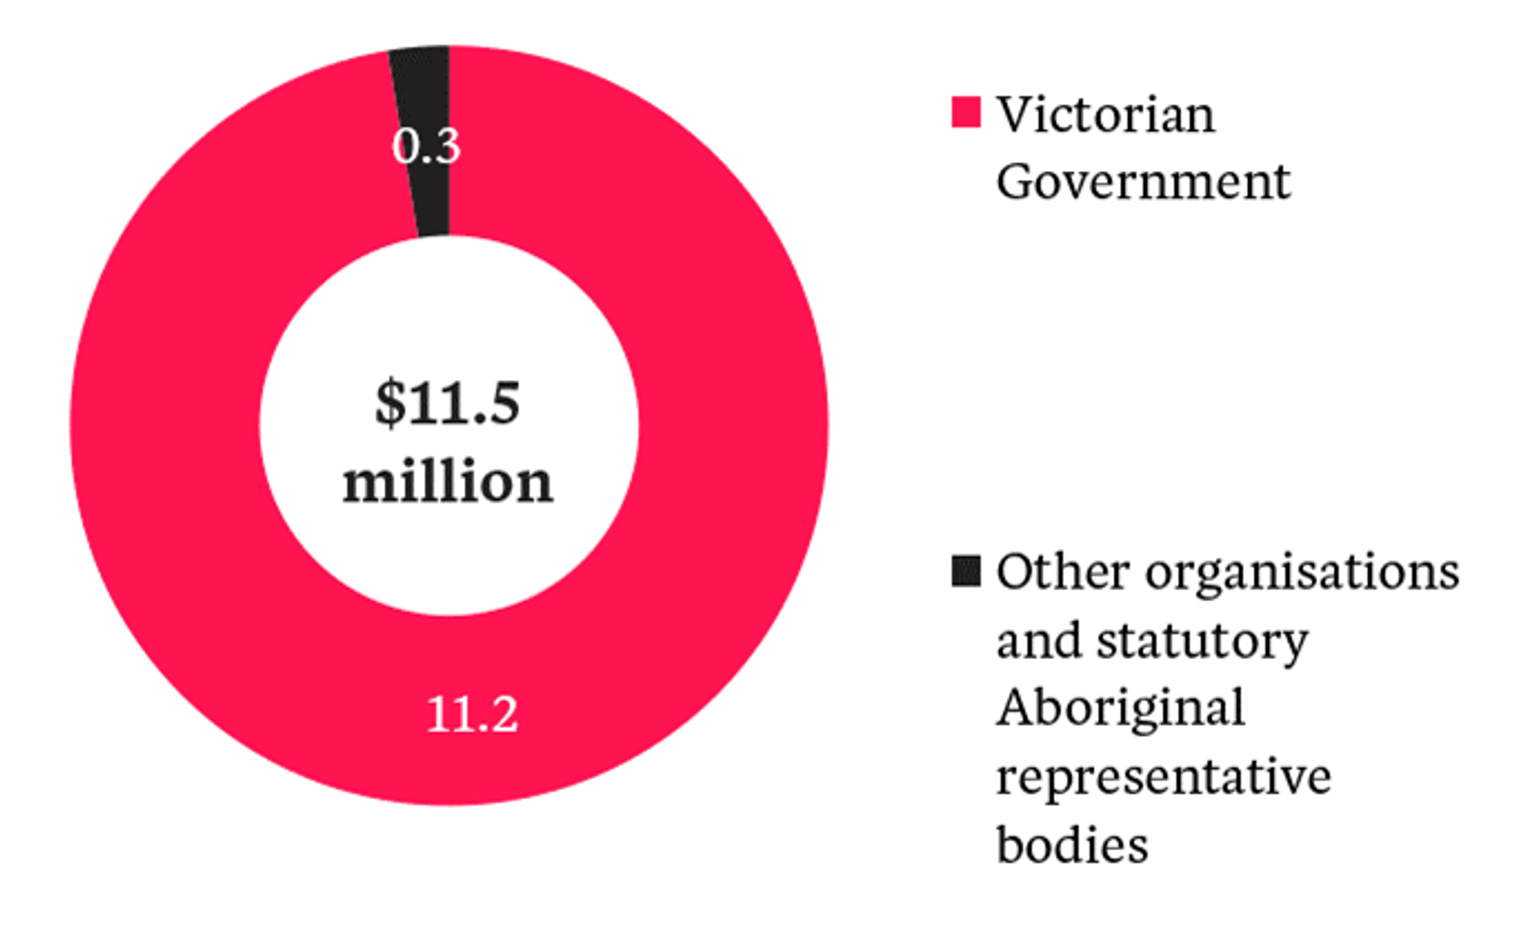
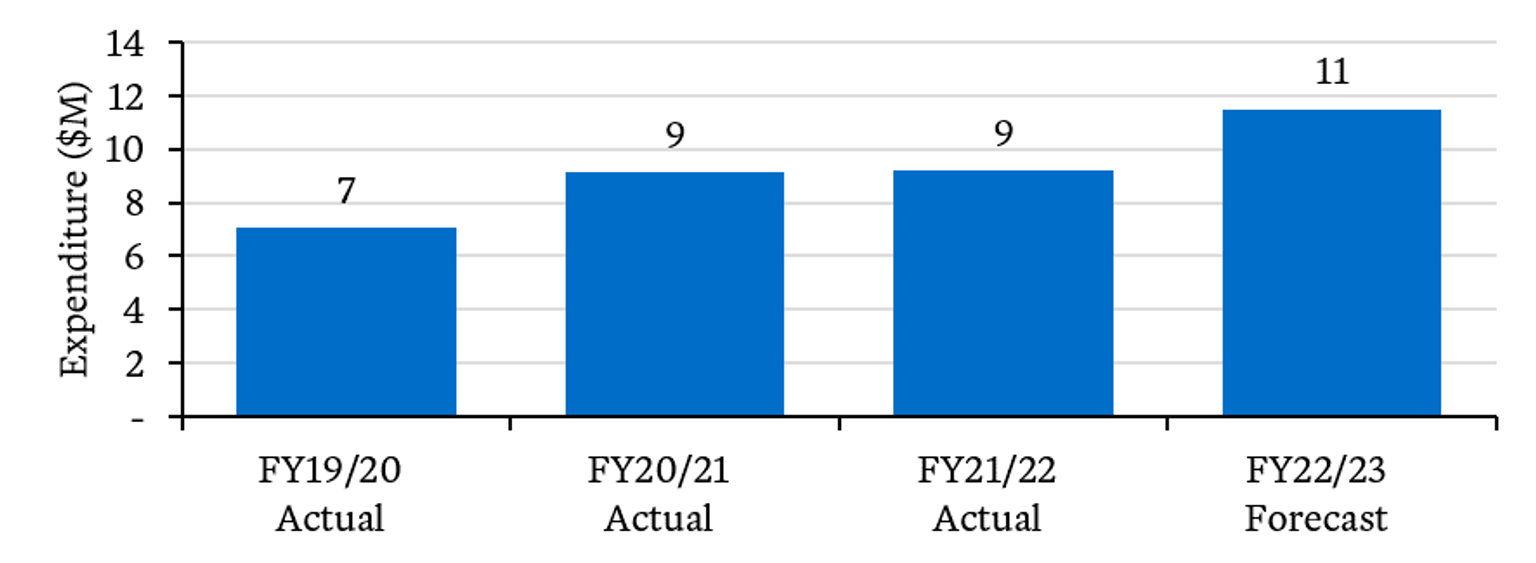
Court Services Victoria
Court Services Victoria spend grew from $7M in FY19/20 to $11M in FY22/23 (+$4M).
- Growth in expenditure is due to both to new programs being added in later years and an increase in expenditure across individual programs.
- Most of the expenditure is delivered through the Victorian Government, with only one item delivered through Other organisations and statutory Aboriginal representative bodies.
Key facts
FY22/23 targeted expenditure by service provider type ($M)
Targeted expenditure over time ($M)
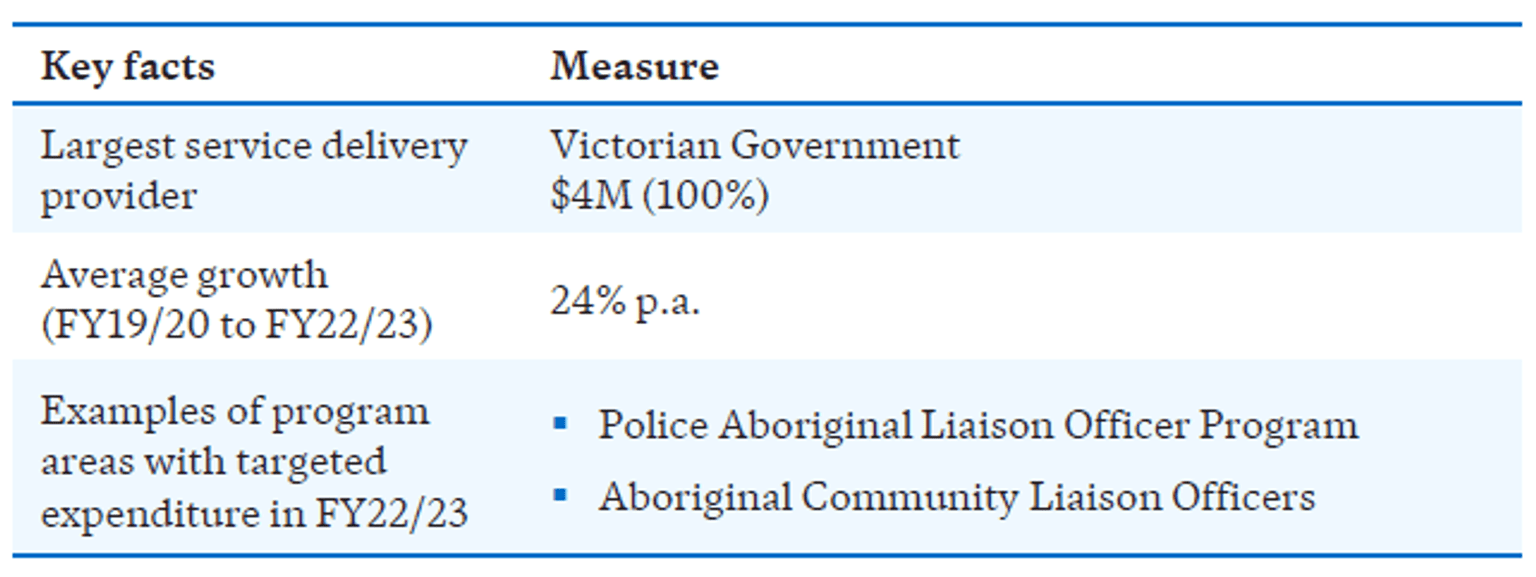
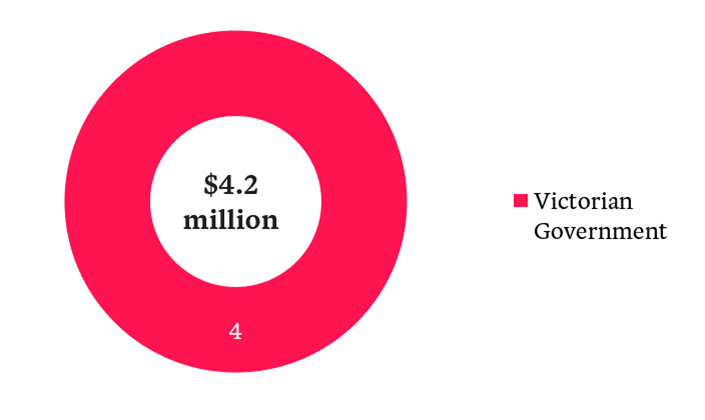
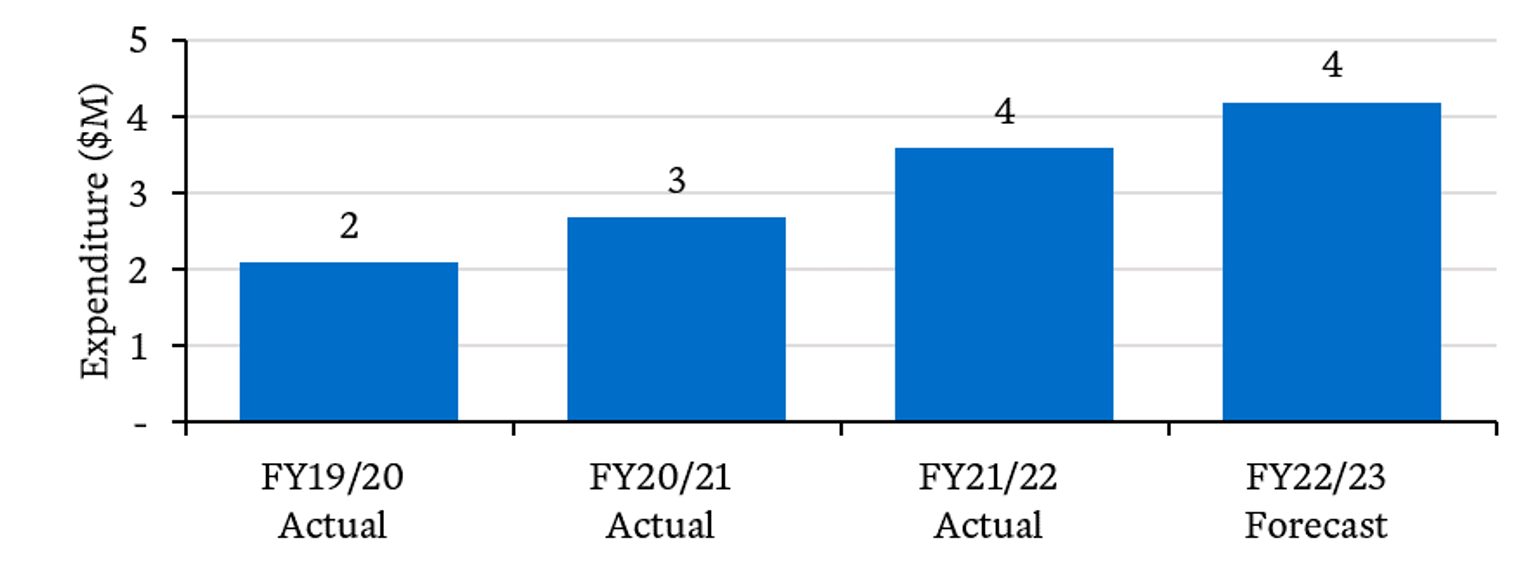
Victoria Police
Victoria Police spend grew from $2M in FY19/20 to $4M in FY22/23 (+$2M).
- Growth in expenditure is due to an increase in spend across programs and the addition of several new programs across the reporting period.
- A significant amount of the growth is due to the implementation of the Police Aboriginal Liaison Officer Program in FY20/21, which grew from $0.4M in FY20/21 to $1.1M in FY22/23.
- All Victoria Police expenditure is delivered by the Victorian Government.
Key facts
FY22/23 targeted expenditure by service provider type ($M)

Targeted expenditure over time ($M)
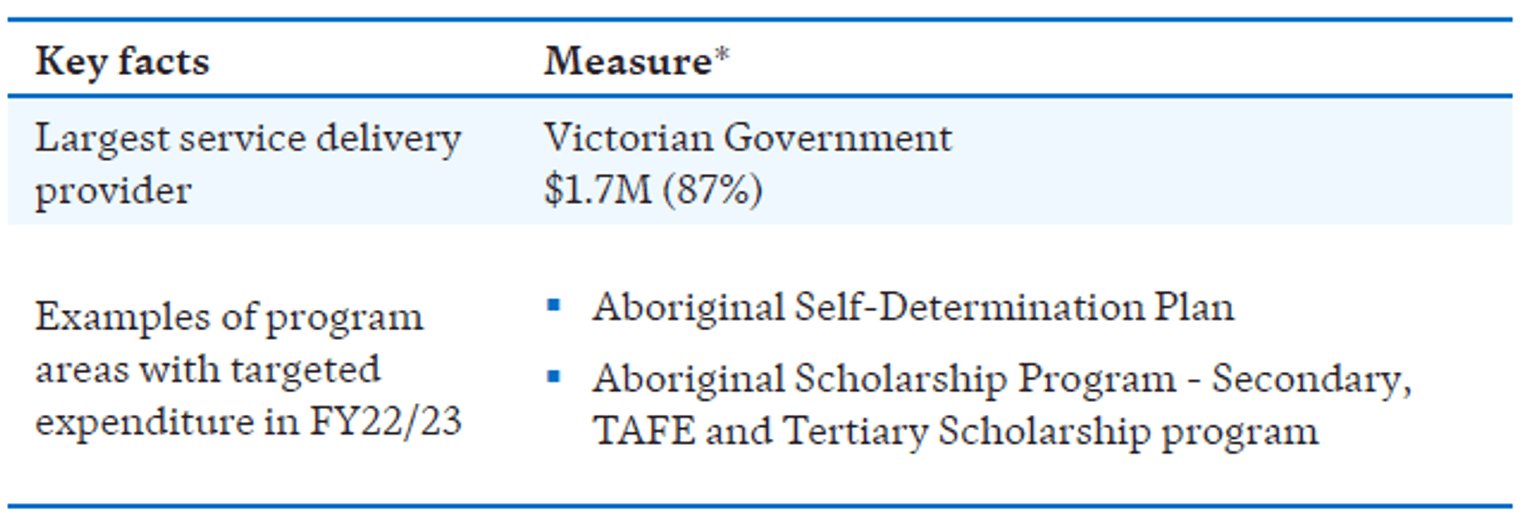
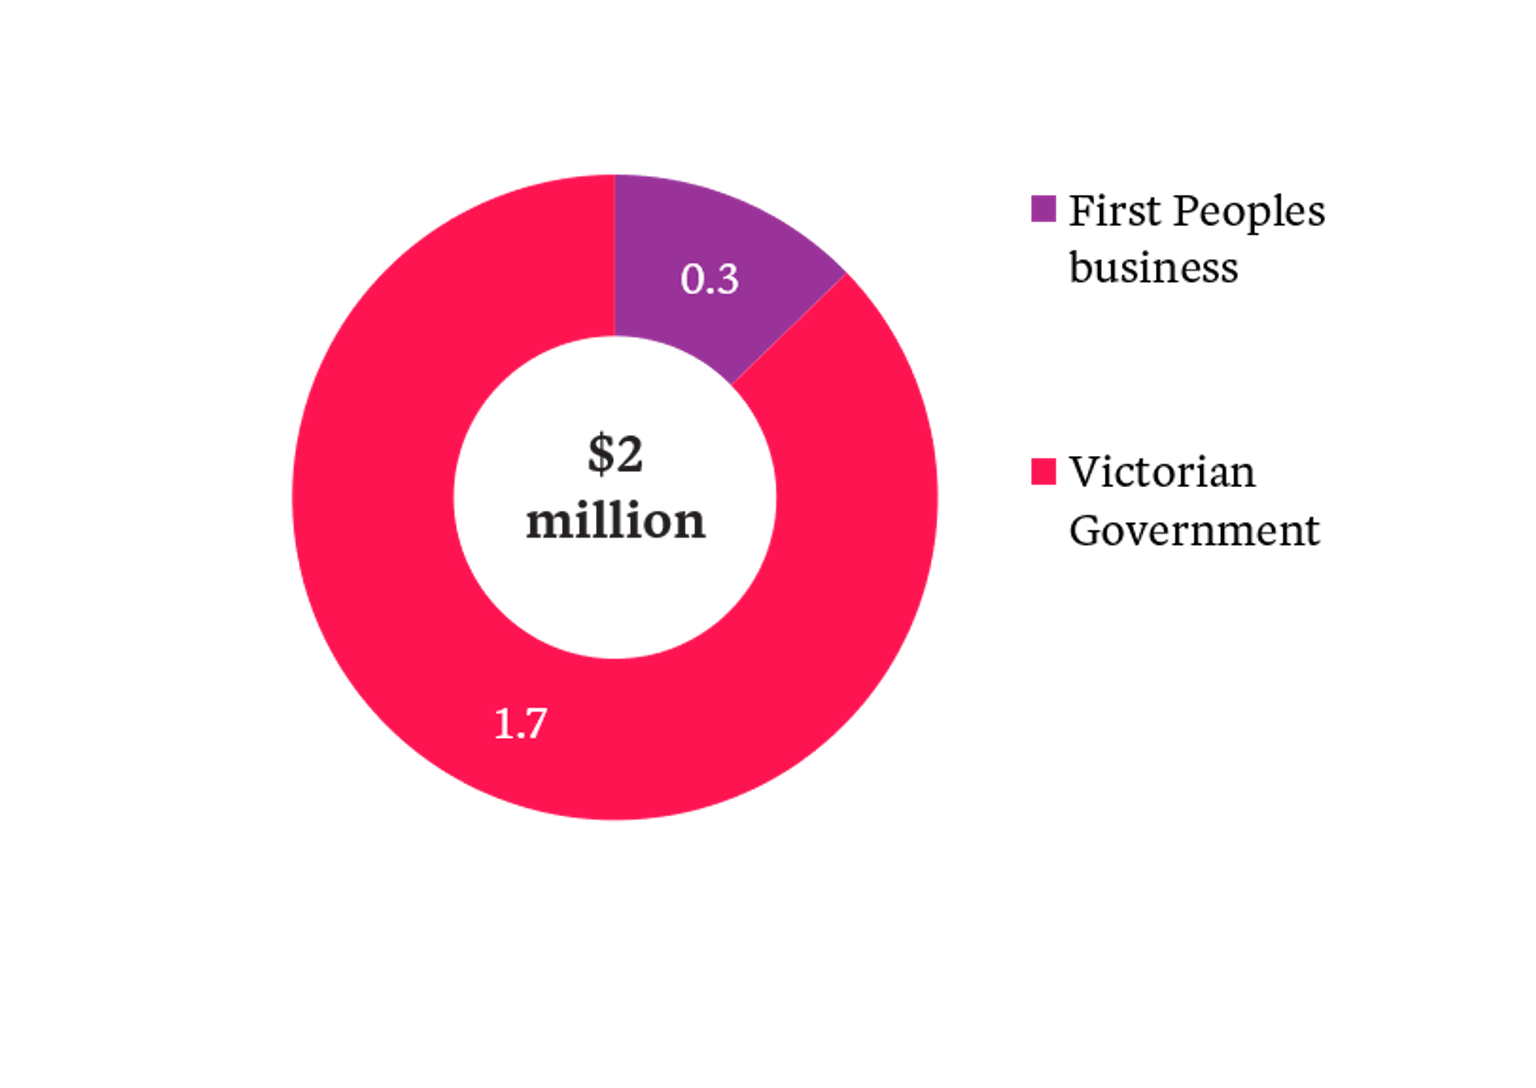
Department of Transport and Planning
Department of Transport and Planning expenditure grew from $0.3M reported expenditure in FY20/21 to $2M in FY22/23.
- Growth in expenditure for FY22/23 is driven by expenditure on the Aboriginal Self-Determination Plan.
- In addition to the amounts reported, the Department of Transport and Planning noted that the Victorian Government established the Major Transport Infrastructure Authority to deliver key transport infrastructure programs. These projects have Aboriginal Employment Hours targets.
- Most of the department’s targeted expenditure is delivered by the Victorian Government.
Key facts
FY22/23 targeted expenditure by service provider type ($M)
Targeted expenditure over time ($M)

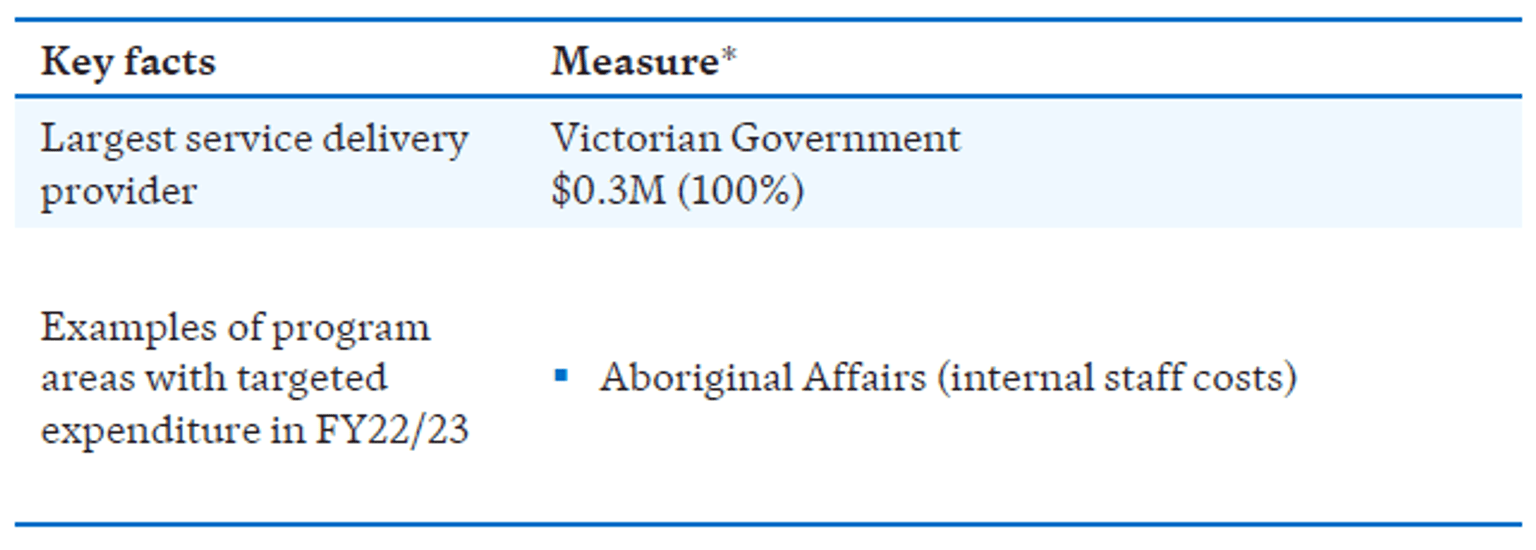
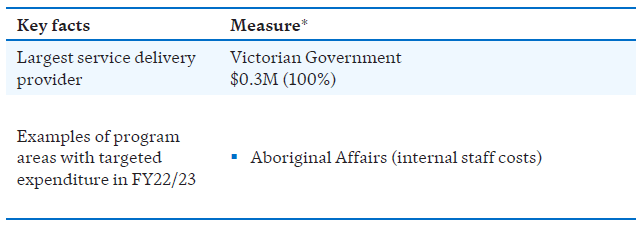
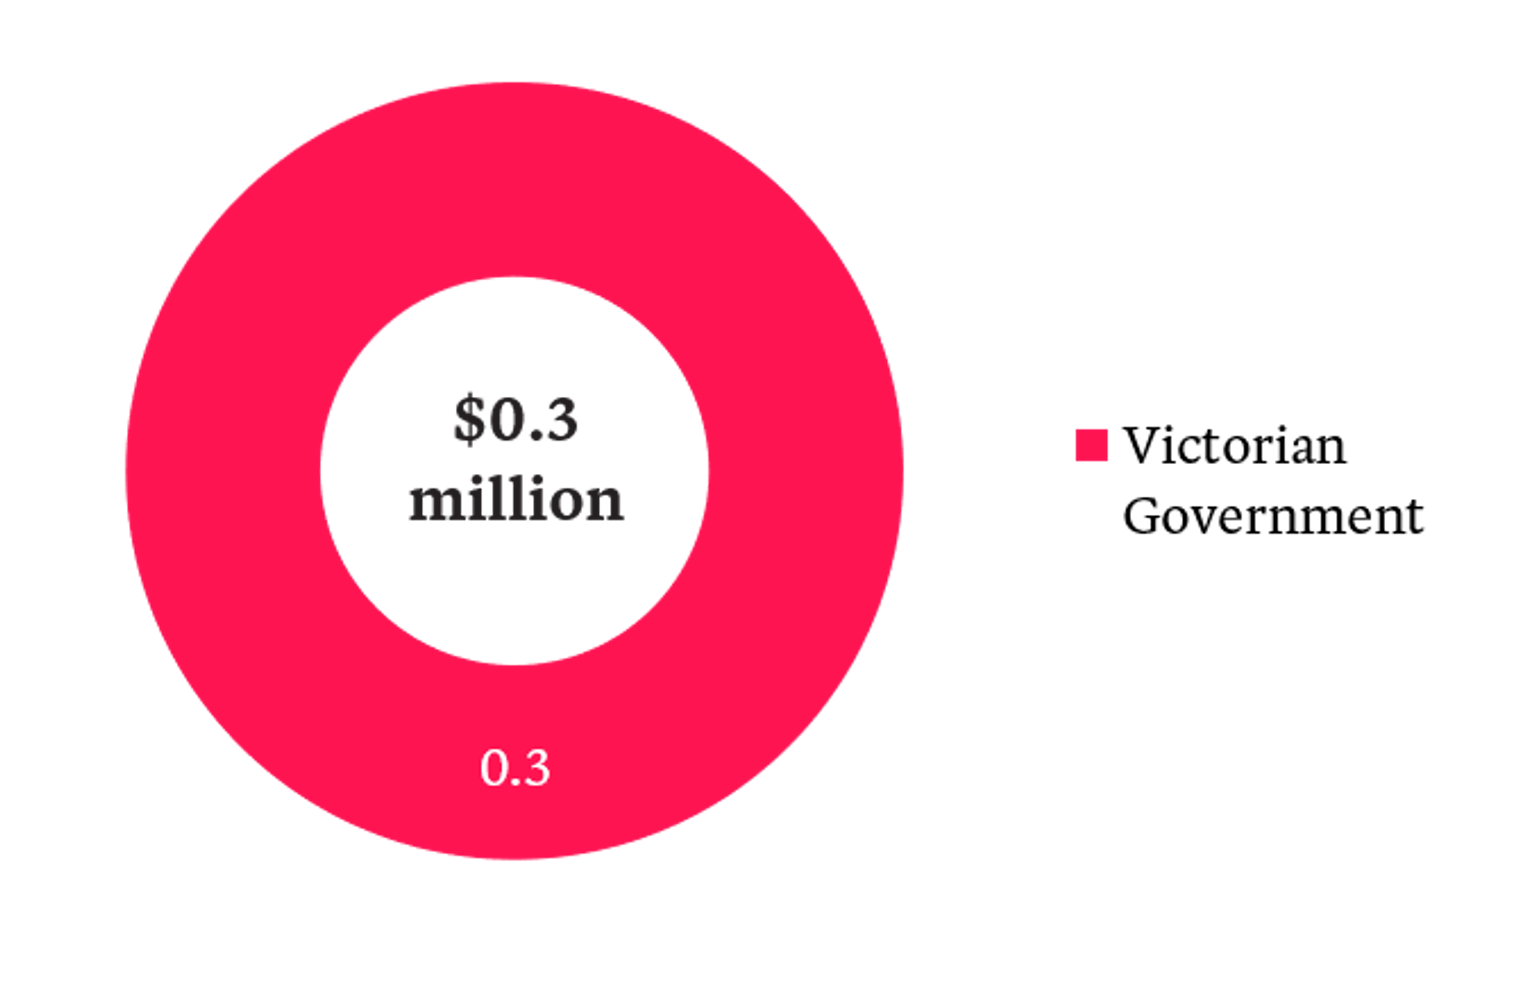
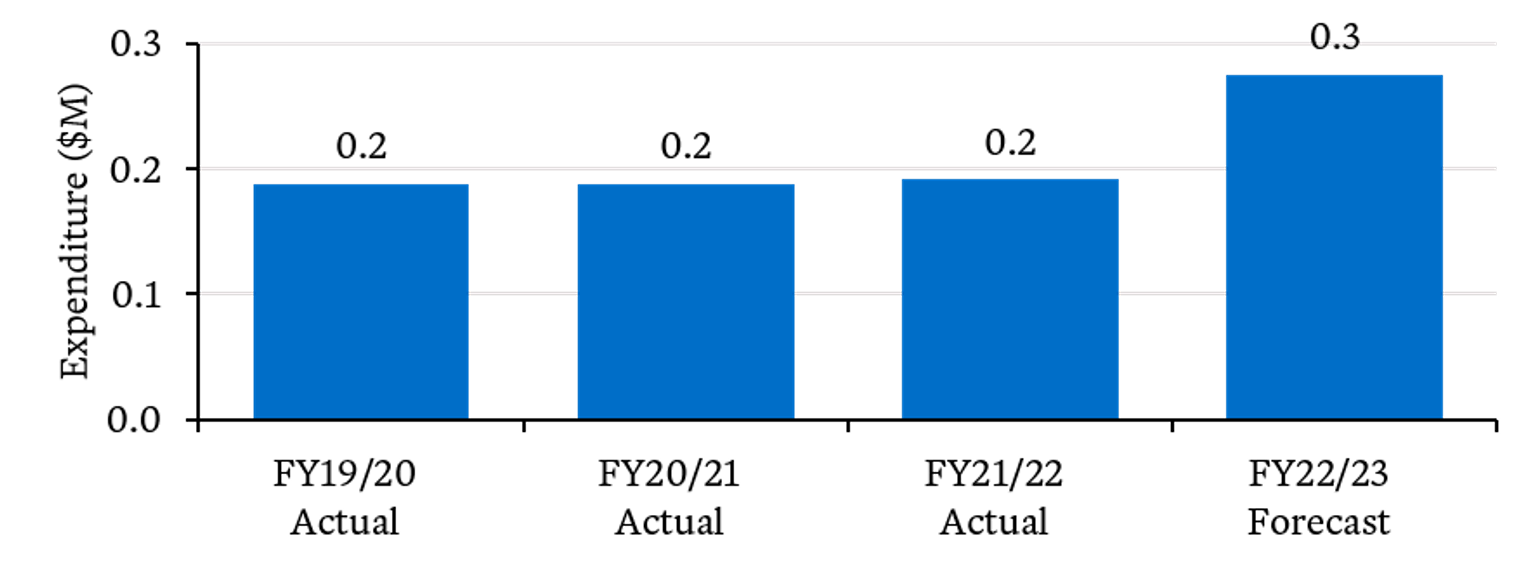
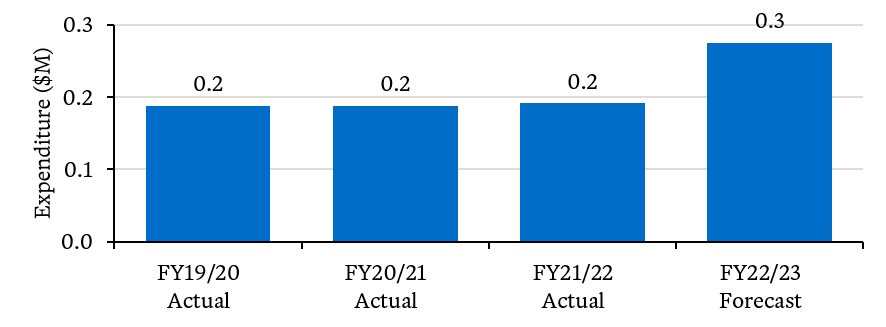
Department of Treasury and Finance
Department of Treasury and Finance contributed approximately $0.3M in expenditure from FY19/20 to FY22/23.
- There was only one item of targeted expenditure (Aboriginal Affairs) within the Department of Treasury and Finance, delivered by the Victorian Government.
Key facts
FY22/23 targeted expenditure by service provider type ($M)
Targeted expenditure over time ($M)
Updated